
|
Fig. 1
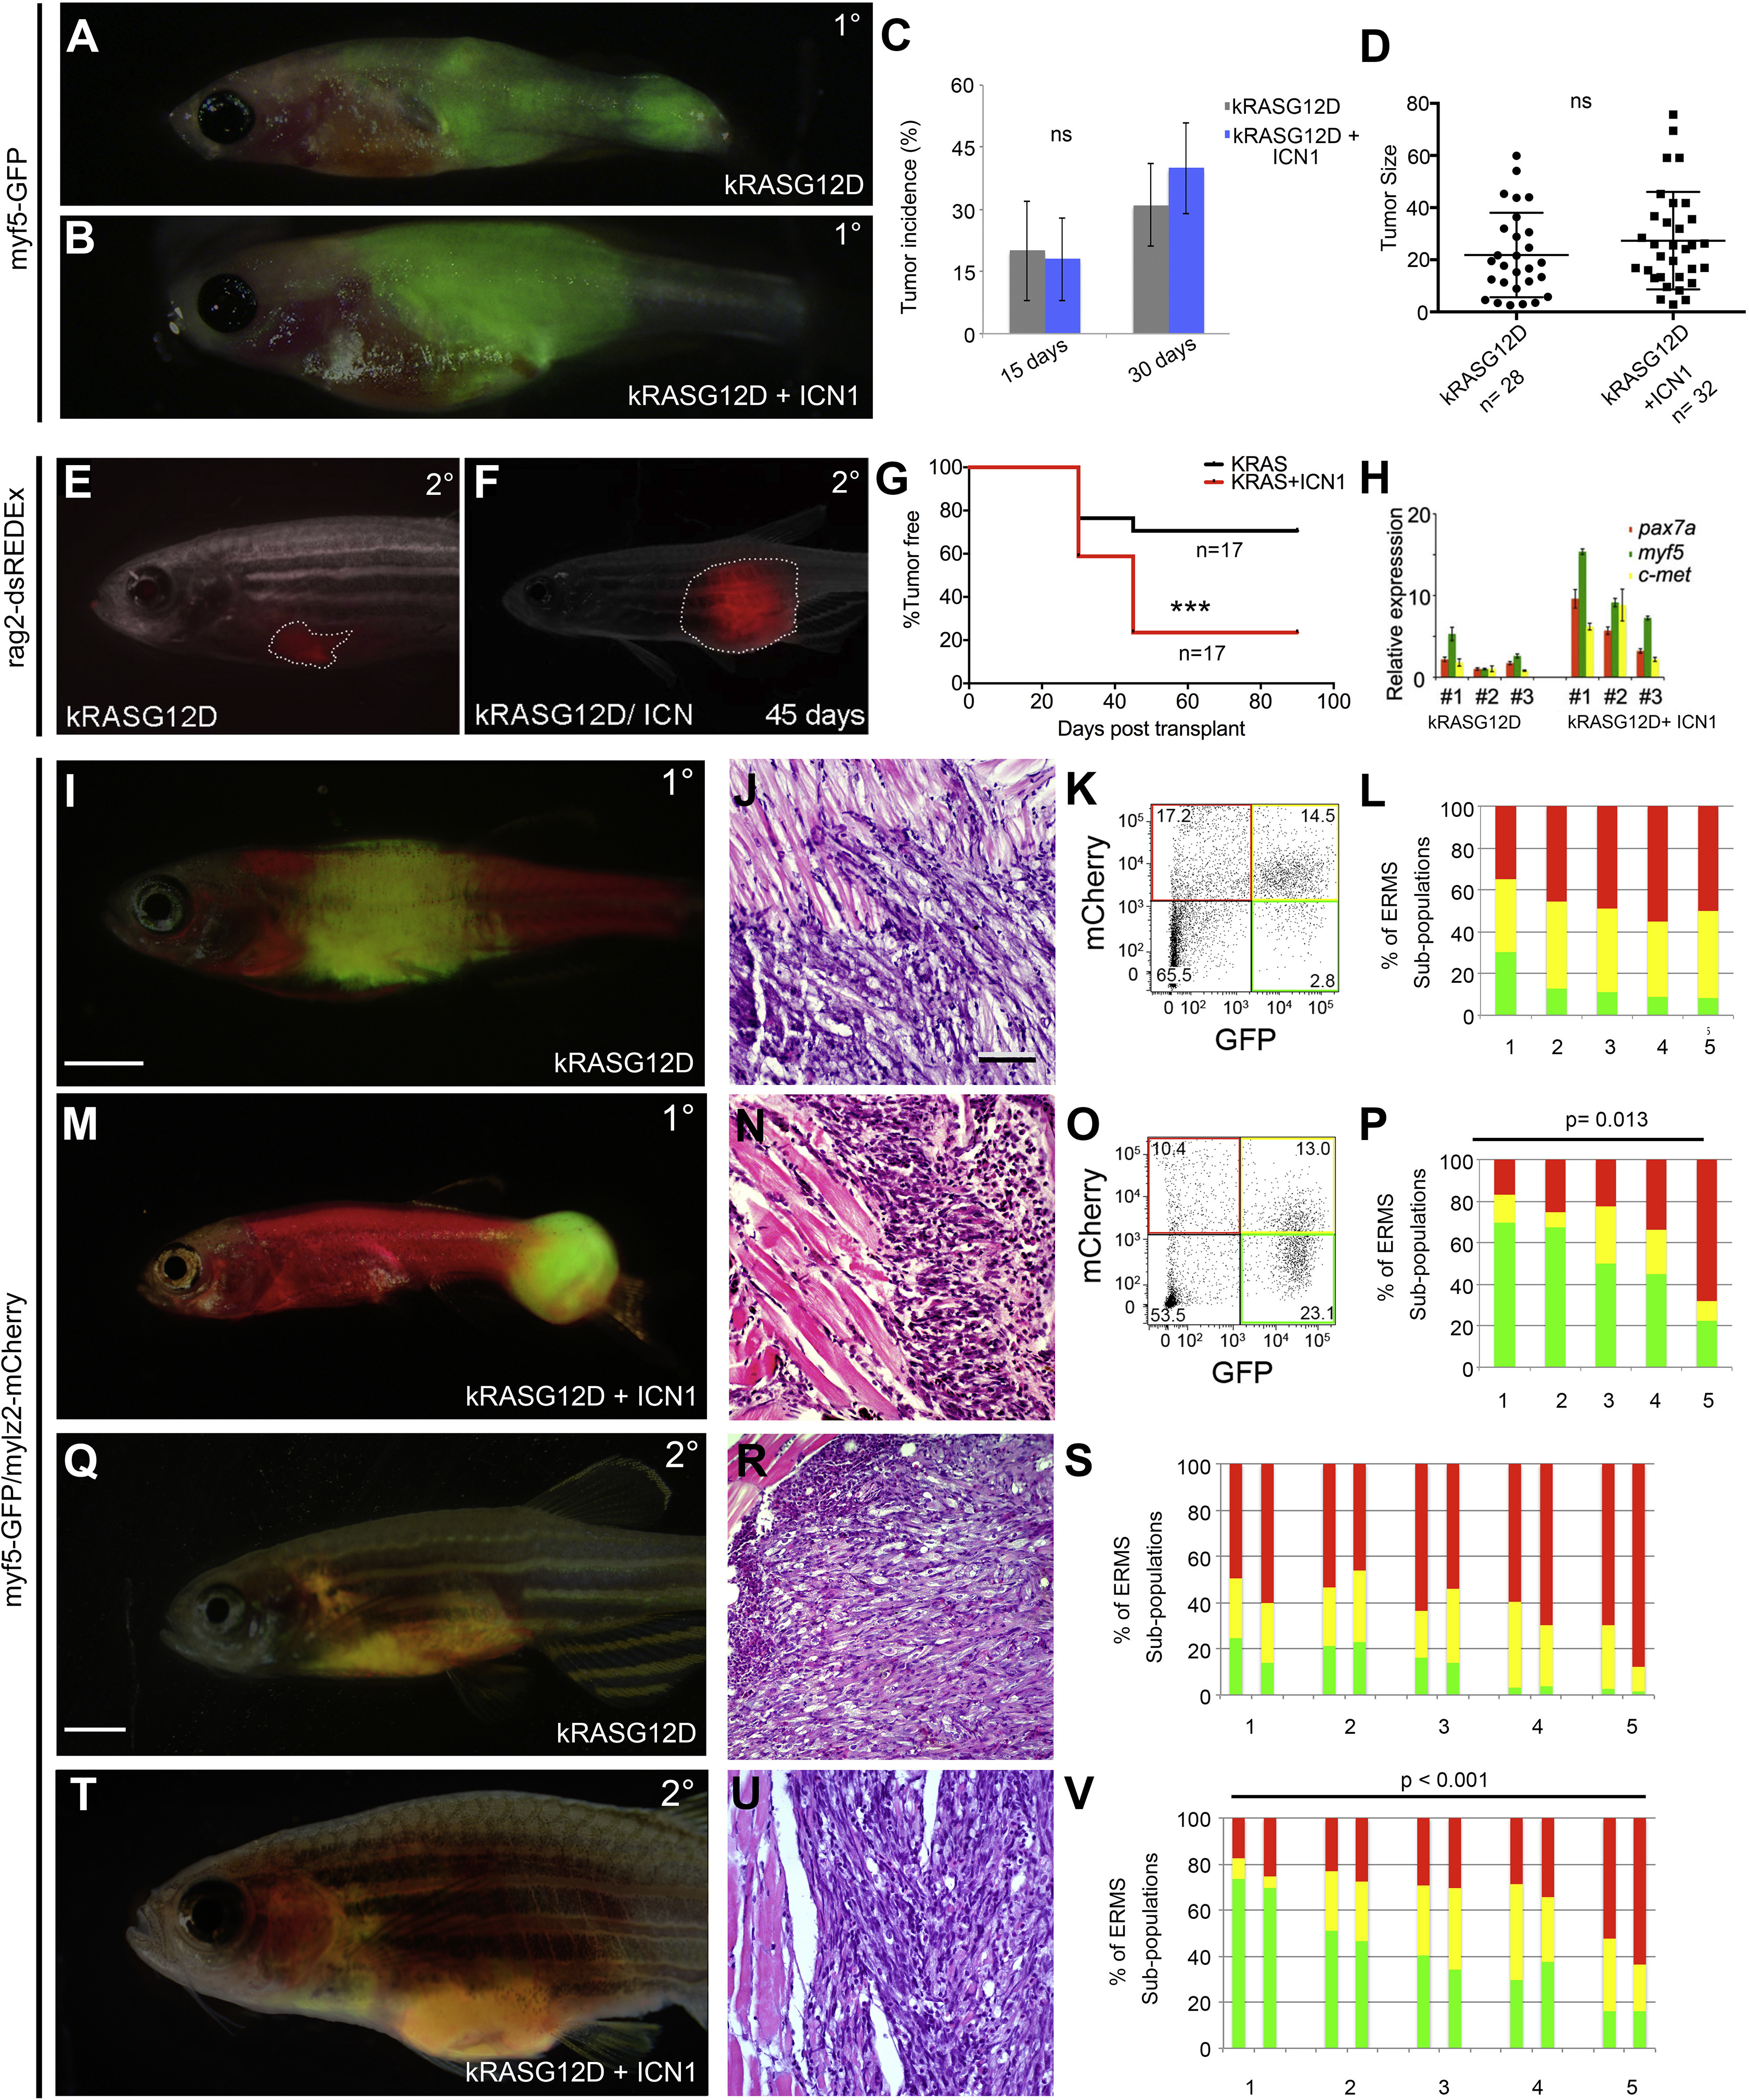
Notch1 Pathway Activation Increases the Number of myf5+ Progenitor Cells in Zebrafish ERMS
(A and B) ERMS generated in Tg(myf5-GFP) zebrafish expressing (A) kRASG12D or (B) kRASG12D + ICN1.
(C and D) Shown here: (C) tumor incidence and (D) size comparing ERMS at 15 and 30 days of life. Relative tumor size was measured at day 30. ns, not significant.
(E and F) Images showing the difference in size of syngeneic zebrafish engrafted with 1 × 10⁴ bulk tumor cells labeled with rag2-dsRedExpress and imaged at day 45. Tumor boundaries are denoted by dashed lines.
(G) Kaplan-Meijer analysis denoting differences in engraftment rates; n = 17 transplant animals per group from four independent tumors per group (p < 0.0001, log-rank statistic).
(H) Real-time qPCR gene expression performed on sorted dsRedExpress+ ERMS cells arising within individual tumors. ∗p < 0.05, Student’s t test.
(I–P) Primary ERMS arising in Tg(myf5-GFP; mylz2-mCherry) animals. ERMS expressing (I–L) kRASG12D alone and (M–P) kRASG12D + ICN1. (I and M) Whole animal images, (J and N) H&E-stained sections, and (K, O, L, and P) representative flow cytometry. Graphical analysis showing percentages of fluorescent-labeled ERMS subpopulations within individual tumors following FACS. Five independent primary tumors were assessed, and each is denoted by numbers on the x axis. (p = 0.013, Student’s t test).
(Q–V) Transplanted ERMS arising from Tg(myf5-GFP; mylz2-mCherry) tumors. (Q–S) ERMS expressing kRASG12D alone and (T–V) kRASG12D + ICN1. (Q and T) Whole animal images of transplant animals, (R and U) H&E-stained sections, and (S and V) bar graphs showing fluorescent-labeled ERMS subpopulations following FACS. Five independent primary transplanted tumors were engrafted into CG1 fish, and each are denoted by numbers on the x axis. FACS populations for two representative engrafted fish per tumor are shown (p < 0.001, Student’s t test).
Scale bars in (I) and (Q), also pertaining to (M) and (T), 2 mm; scale bar in (J), also pertaining to (N), (R), and (U), 50 μm. See also Figure S1.