
|
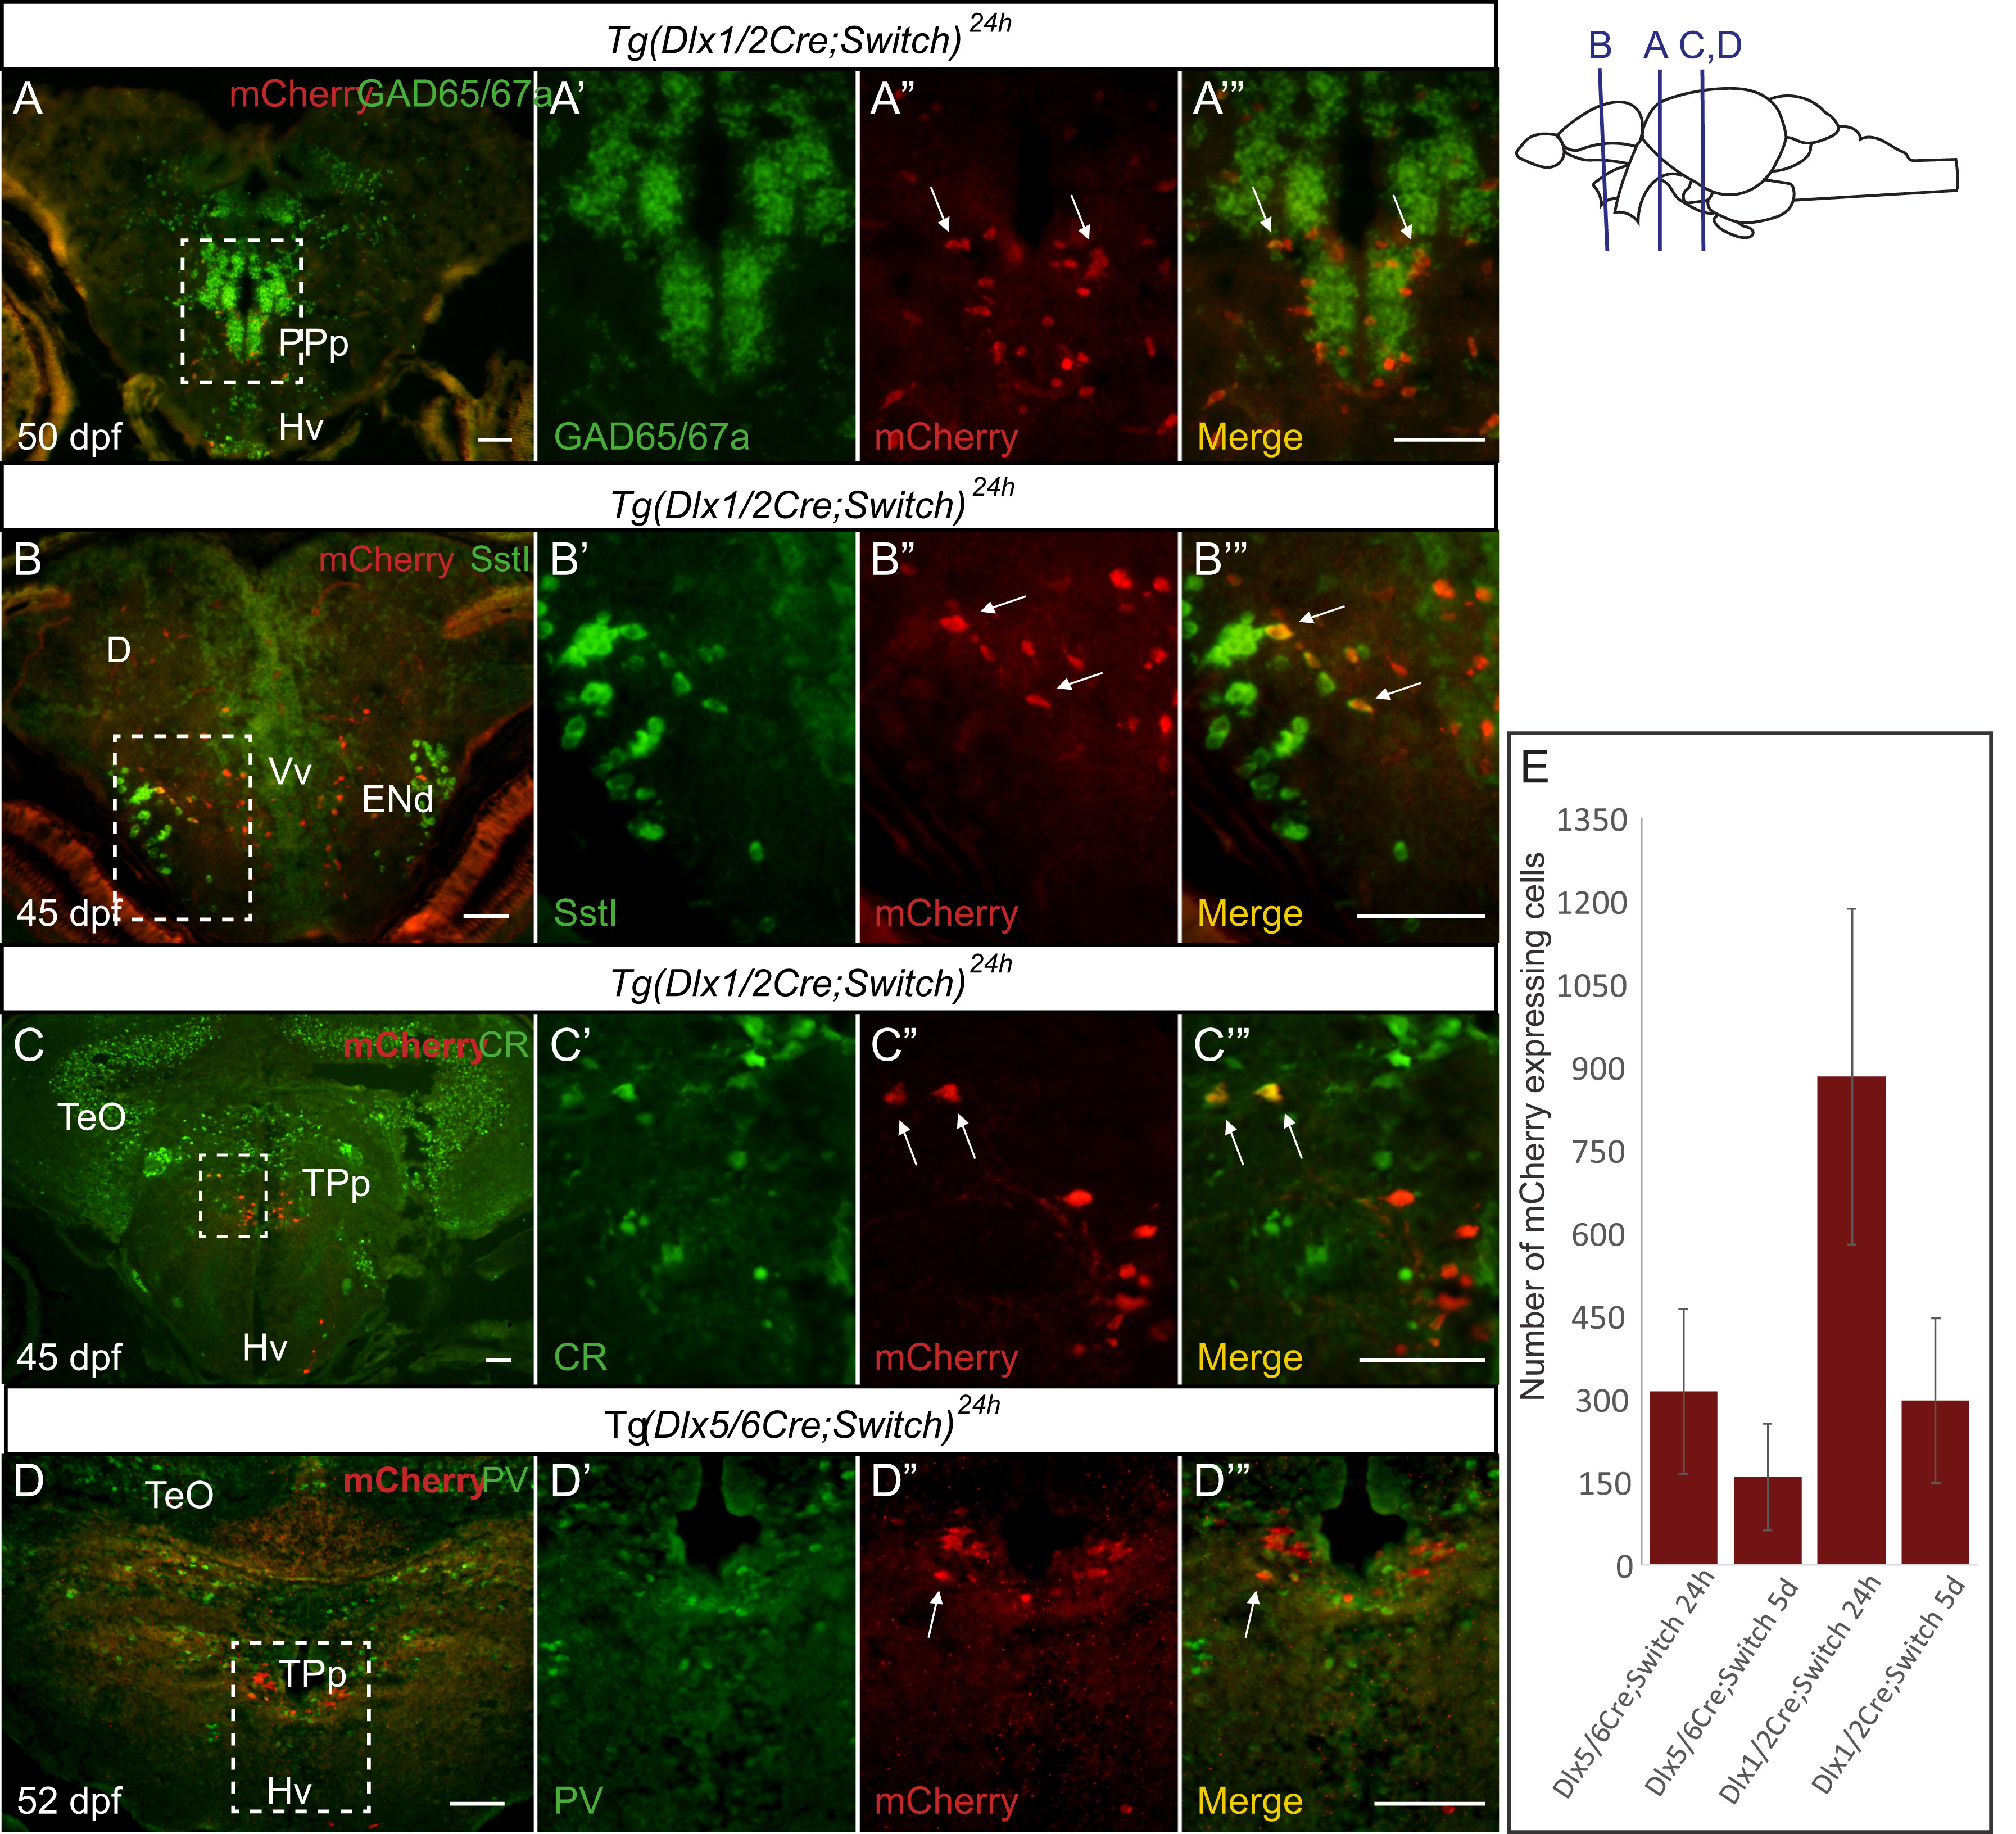
Fig. 7
Colocalization of mCherry cells with GABAergic markers in the juvenile brain. (A-B) ISH for gad65 and gad67a (green, A) or sstI (green, B) coupled with IHC against mCherry (red) on cryosections of juvenile zebrafish brains. (C-D) Double immunohistochemical labeling of juvenile brains for mCherry (red) and calretinin (green, C) or parvalbumin (green, D). Examples of cells that express both mCherry and the GABAergic marker (yellow) are indicated by white arrows in the insets in A''-D'' and A'''-D'''. (E) Number of mCherry-expressing cells detected by IHC in cryosections of larvae from Tg(dlx1/2Cre;Switch) and Tg(dlx5/6Cre;Switch) induced with 4-OHT at 24 hpf (left) and 5 dpf (right) in juvenile animals (45–60 dpf). n=2–4 samples per condition per time point. Error bars: SEM. See Table S2 for sample sizes. Scale bar: 20 µm.
Reprinted from Developmental Biology, 427(1), Solek, C.M., Feng, S., Perin, S., Weinschutz Mendes, H.C., Ekker, M., Lineage tracing of dlx1a/2a and dlx5a/6a expressing cells in the developing zebrafish brain, 131-147, Copyright (2017) with permission from Elsevier. Full text @ Dev. Biol.