
|
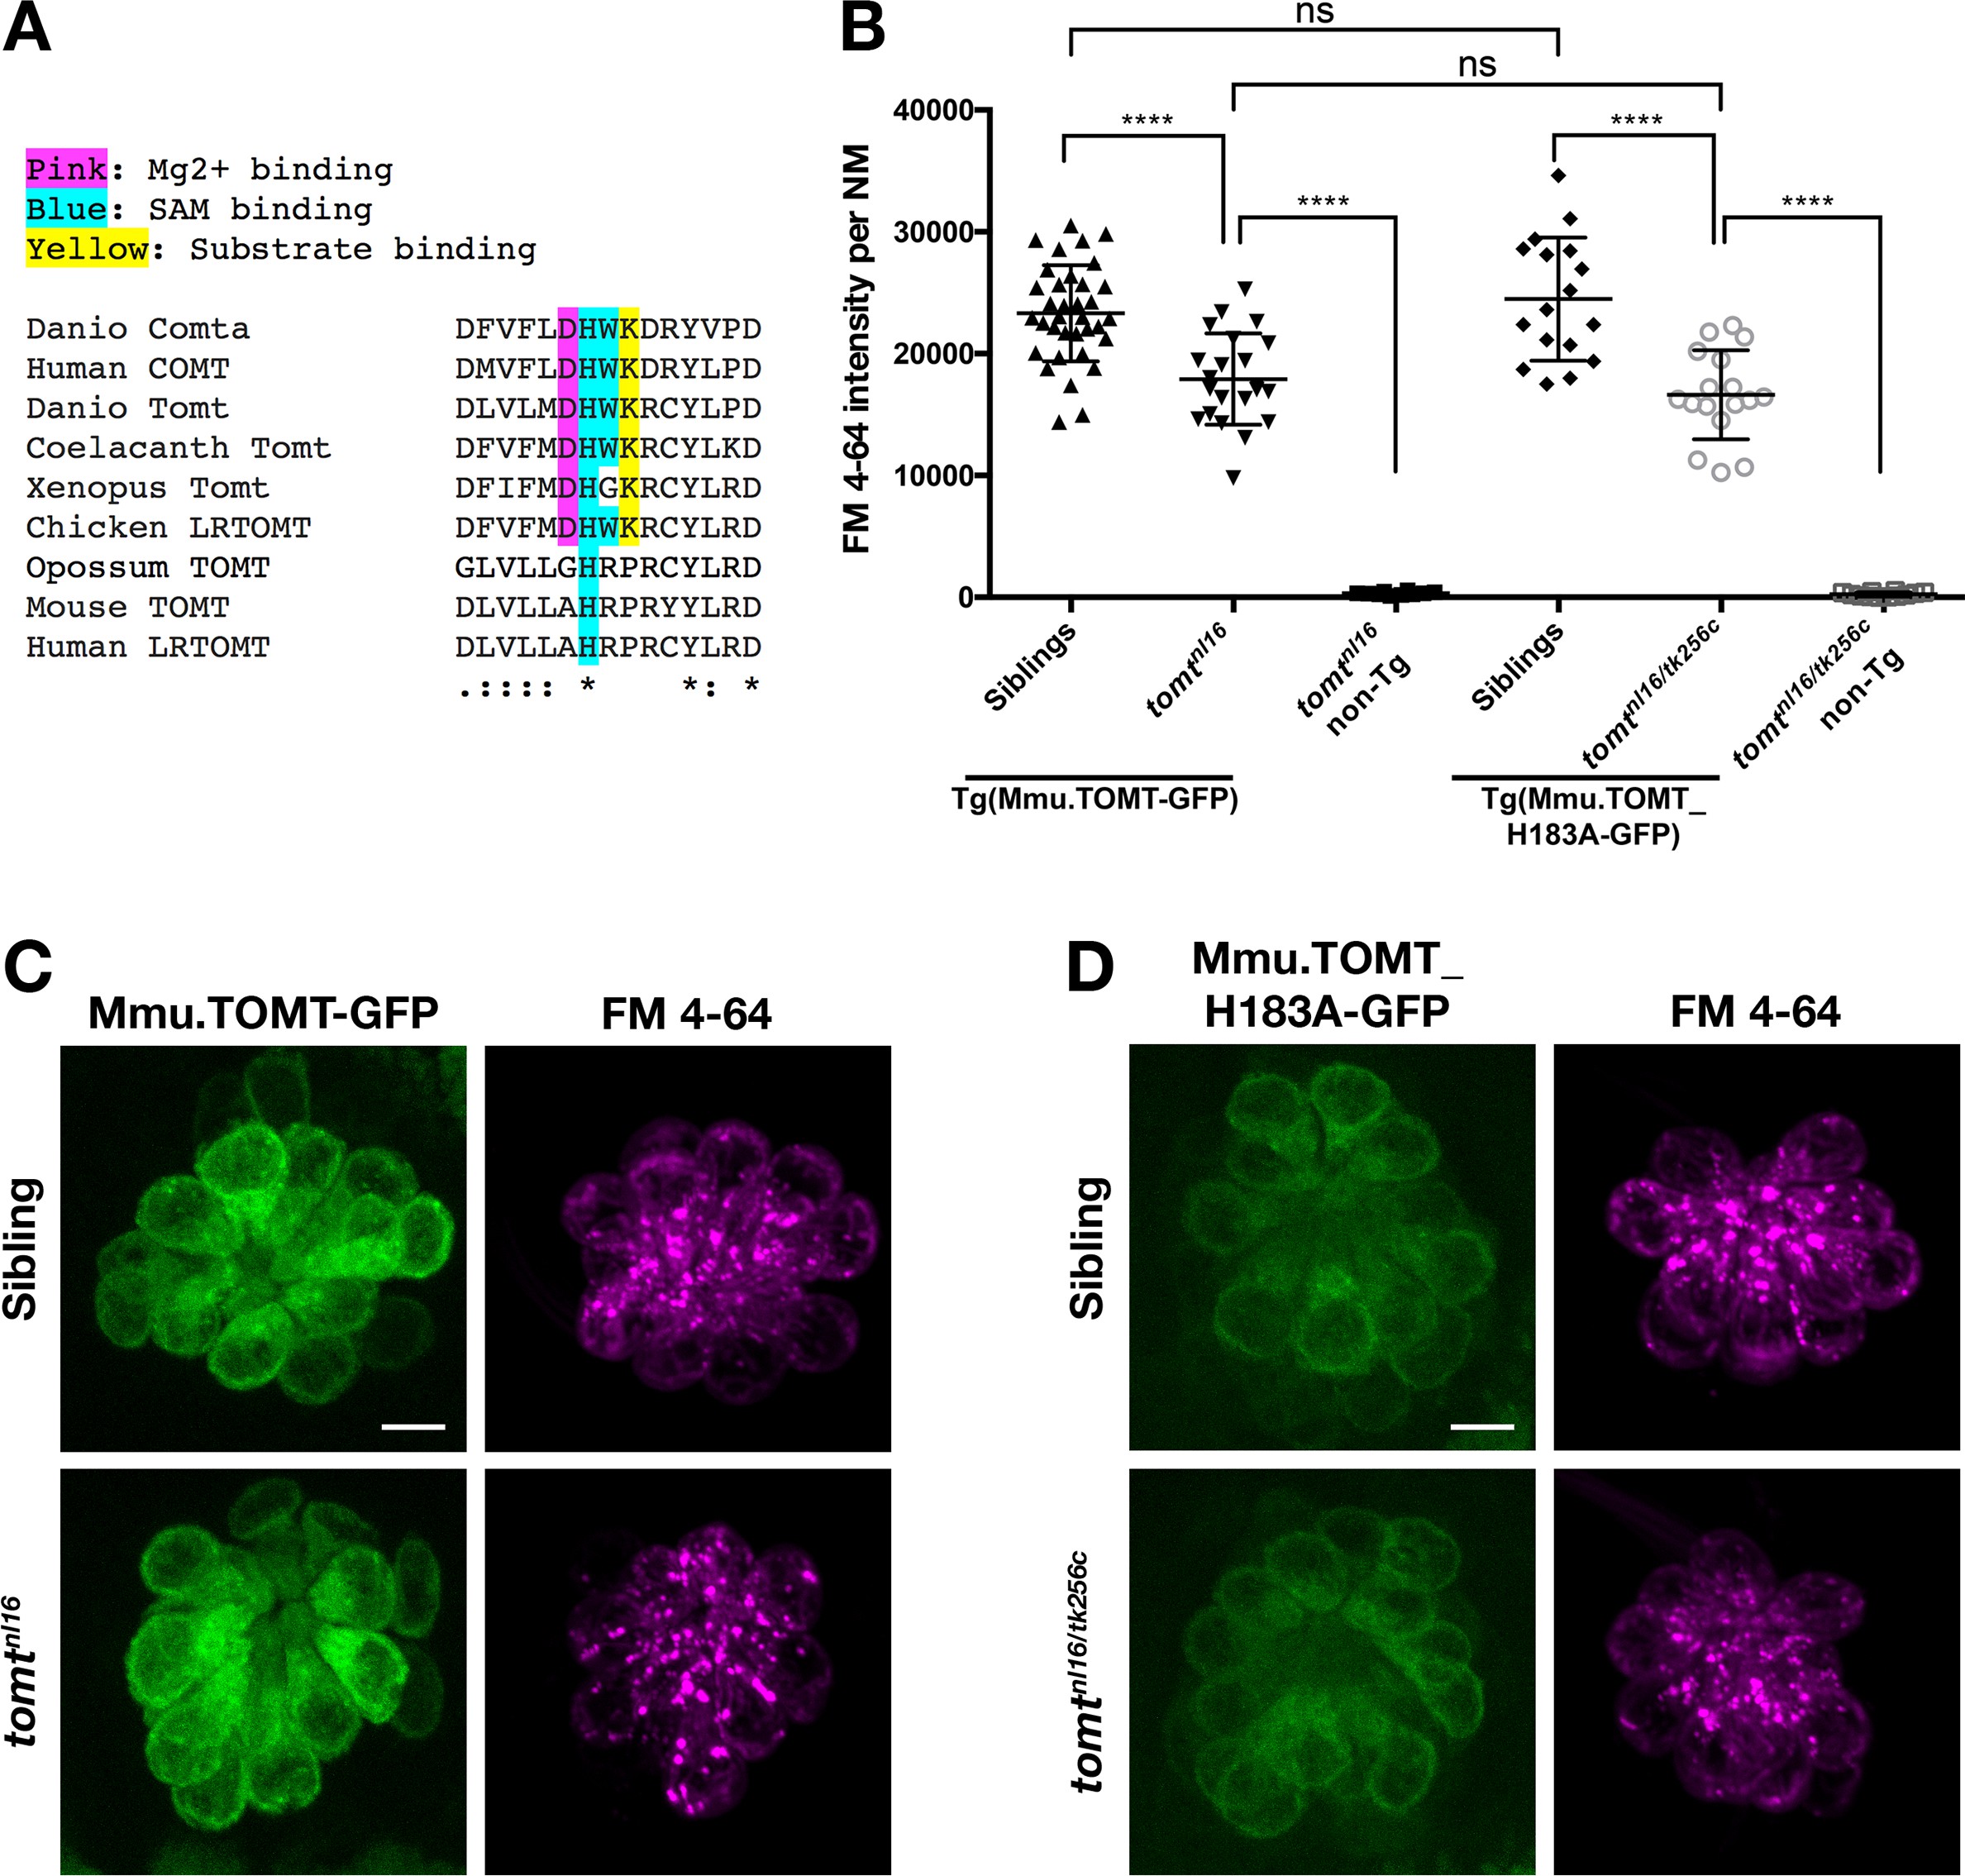
Fig. 8
Mouse TOMT can restore basal MET channel activity to mercury mutant hair cells.
(A) Alignment between putative active site residues in Danio rerio Comta (Asp178-Asp192; NP_001025328), Human MB-COMT (Asp186-Asp200; NP_000745), and Tomt/LRTOMT proteins from Danio rerio (Asp178-Asp19; ANO40802), Coelacanth (Asp178-Asp192; XP_006003643), Xenopus tropicalis (Asp206-Asp220; XP_004920324), Chicken (Asp178-Asp192; NP_001269010), Opossum (Gly177-Asp191; XP_016277512), Mouse (Asp177-Asp191; NP_001269017), and Human (Asp200-Asp214; NP_001138781. The shaded residues and alignment legend are the same as for Figure 7. (B) Quantification of FM 4–64 fluorescence intensity per NM for tomt mutants stably expressing either mouse TOMT-GFP (myo6b:Mmu.Tomt-GFP; n = 8, 22 NMs) or mouse TOMT-H183A-GFP (myo6b:Mmu.Tomt_H183A-GFP; n = 7, 17 NMs). For comparison, FM 4–64 fluorescence values are included for transgenic siblings (TOMT-GFP: n = 12, 35 NMs; TOMT-H183A: n = 8, 17 NMs) and non-transgenic mutants (tomtnl16: n = 4; 10 NMs; tomtnl16/tk256c: n = 6, 12 NMs). Error bars are the mean ± SD. Asterisks indicate p<0.0001 by one-way ANOVA with Bonferroni's multiple comparison test. (C) Representative images of Mmu.TOMT-GFP (left) and FM 4–64 (right) in lateral line NMs of a 5 dpf Tg(myo6b:Mmu.Tomt-GFP) sibling (top) and a tomtnl16 mutant (bottom). (D) Representative images of Mmu.TOMT_H183A-GFP (left) and FM 4–64 (right) in lateral line NMs of a 4 dpf Tg(myo6b:Mmu.Tomt_H183A-GFP) sibling (top) and a tomtnl16/tk256c mutant (bottom). Images in C and D were near the mean of the FM 4–64 values shown in B. Scale bars = 5 µm in C, D.