
|
Fig. S6
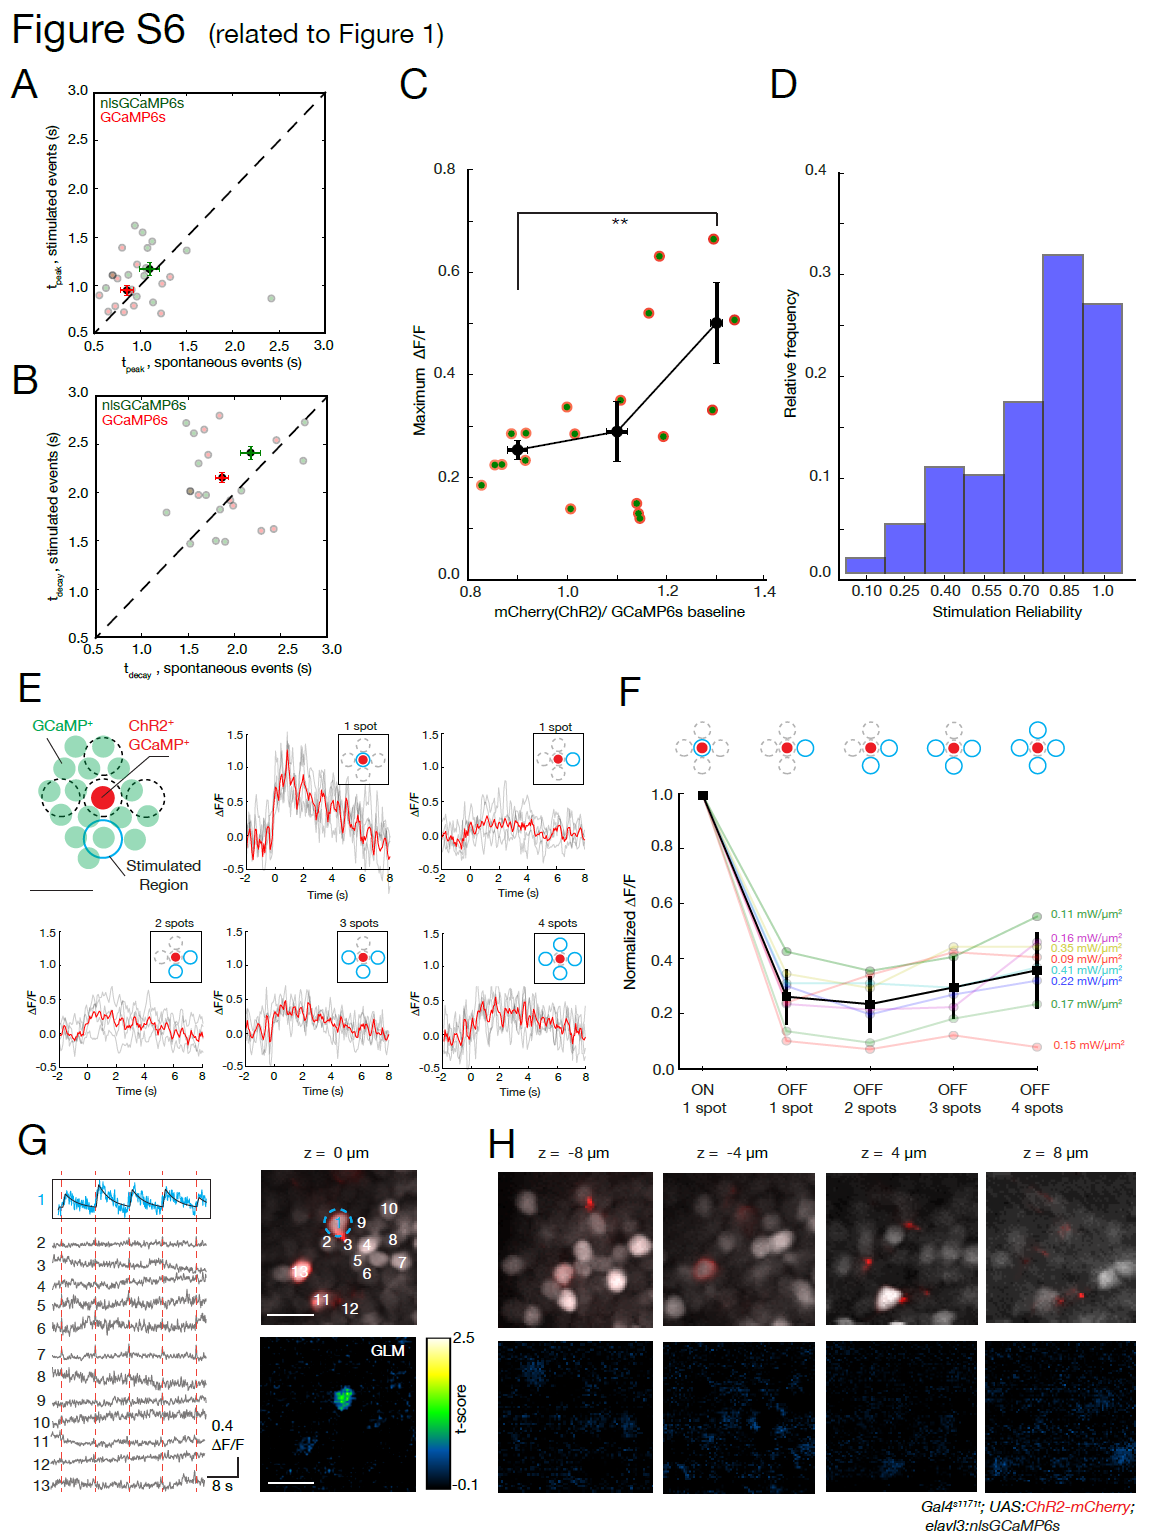
Characterization of induced GCaMP responses and photostimulation resolution (related to Figure 1).
(A) GCaMP onset temporal dynamics. Comparison of the time to the peak (0 to 100%) for GCaMP responses imaged at 1020 nm for events driven by ChR2 photostimulation at 920 nm (0.1 - 0.22 mW/μm2) versus spontaneous events in the same cells. No significant difference was found between the stimulated and spontaneous conditions (p-value 0.35, t-test, saturated colors indicate means, with bars indicating s.e.m.) for GCaMP6s or nlsGCaMP6s.
(B) Comparison of the decay time (to reach 50%) for the same molecules shown in A. No significant difference was found between the two conditions (p-value 0.16, t-test).
(C) Dependency of the recorded ΔF/F on ChR2 expression level. Neurons expressing both nlsGCaMP6s and ChR2 were imaged at 1020 nm with 9 mW while being photo-stimulated at 920 nm with 0.11 mW/μm2. The maximum recorded amplitudes are plotted as function of the ratio between the fluorescence level of ChR2-mcherry and GCaMP baseline. Data were grouped into three bins, black dots and error bars indicate averages and s.e.m respectively (p-value 0.021, t-test).
(D) Histogram of stimulation reliability. Individual cells were repeatedly stimulated, with many cells responding reliably. (50 trials from 10 cells).
(E) Induced ΔF/F in neurons with off-target stimulations. These experiments validate the spatial selectivity of stimulation, starting with a reference using the response to a stimulation spot targeted exactly to a neuron expressing ChR2 (“on-target”, shown in red). This is compared to the response when one or more off-target spots are simultaneously stimulated, each 10 μm from the on-target cell. In all the trials, the power density per spot was constant and matched the power of the on-target spot. For each stimulation pattern (inset with blue icons), a 200 ms activation pulse was applied. The response of the on-target cell is shown in light grey for each trial, with the average in red (4 or more trials per stimulation pattern).
(F) Response characteristics. With respect to the on-target stimulation, the normalized responses to off-target stimulations do not reach comparable levels of activity. The response characteristics for 8 cells (from 3 fish) are color coded, and in black is the mean value (error bars show standard deviation). The corresponding photostimulation power density per spot is indicated on the right.
(G) Example of stimulation precision. A neuron expressing ChR2 is targeted with a 6 μm photostimulation spot. Simultaneous multiplane imaging provides the activity of neurons in the same and nearby planes. On the left are ΔF/F traces for target cell (blue) and surrounding cells. The position of the recorded cells is shown in the upper right panel. The lower right panel shows the t-scores from a pixel-wise generalized linear model (GLM, details in STAR Methods). The targeted cell has the highest tscores for this model of activity based on the stimulation protocol.
(H) Other neurons show only low t-scores, indicating they are not effectively activated by the stimulation. Scale bar is 10 μm.