
|
Fig. 3
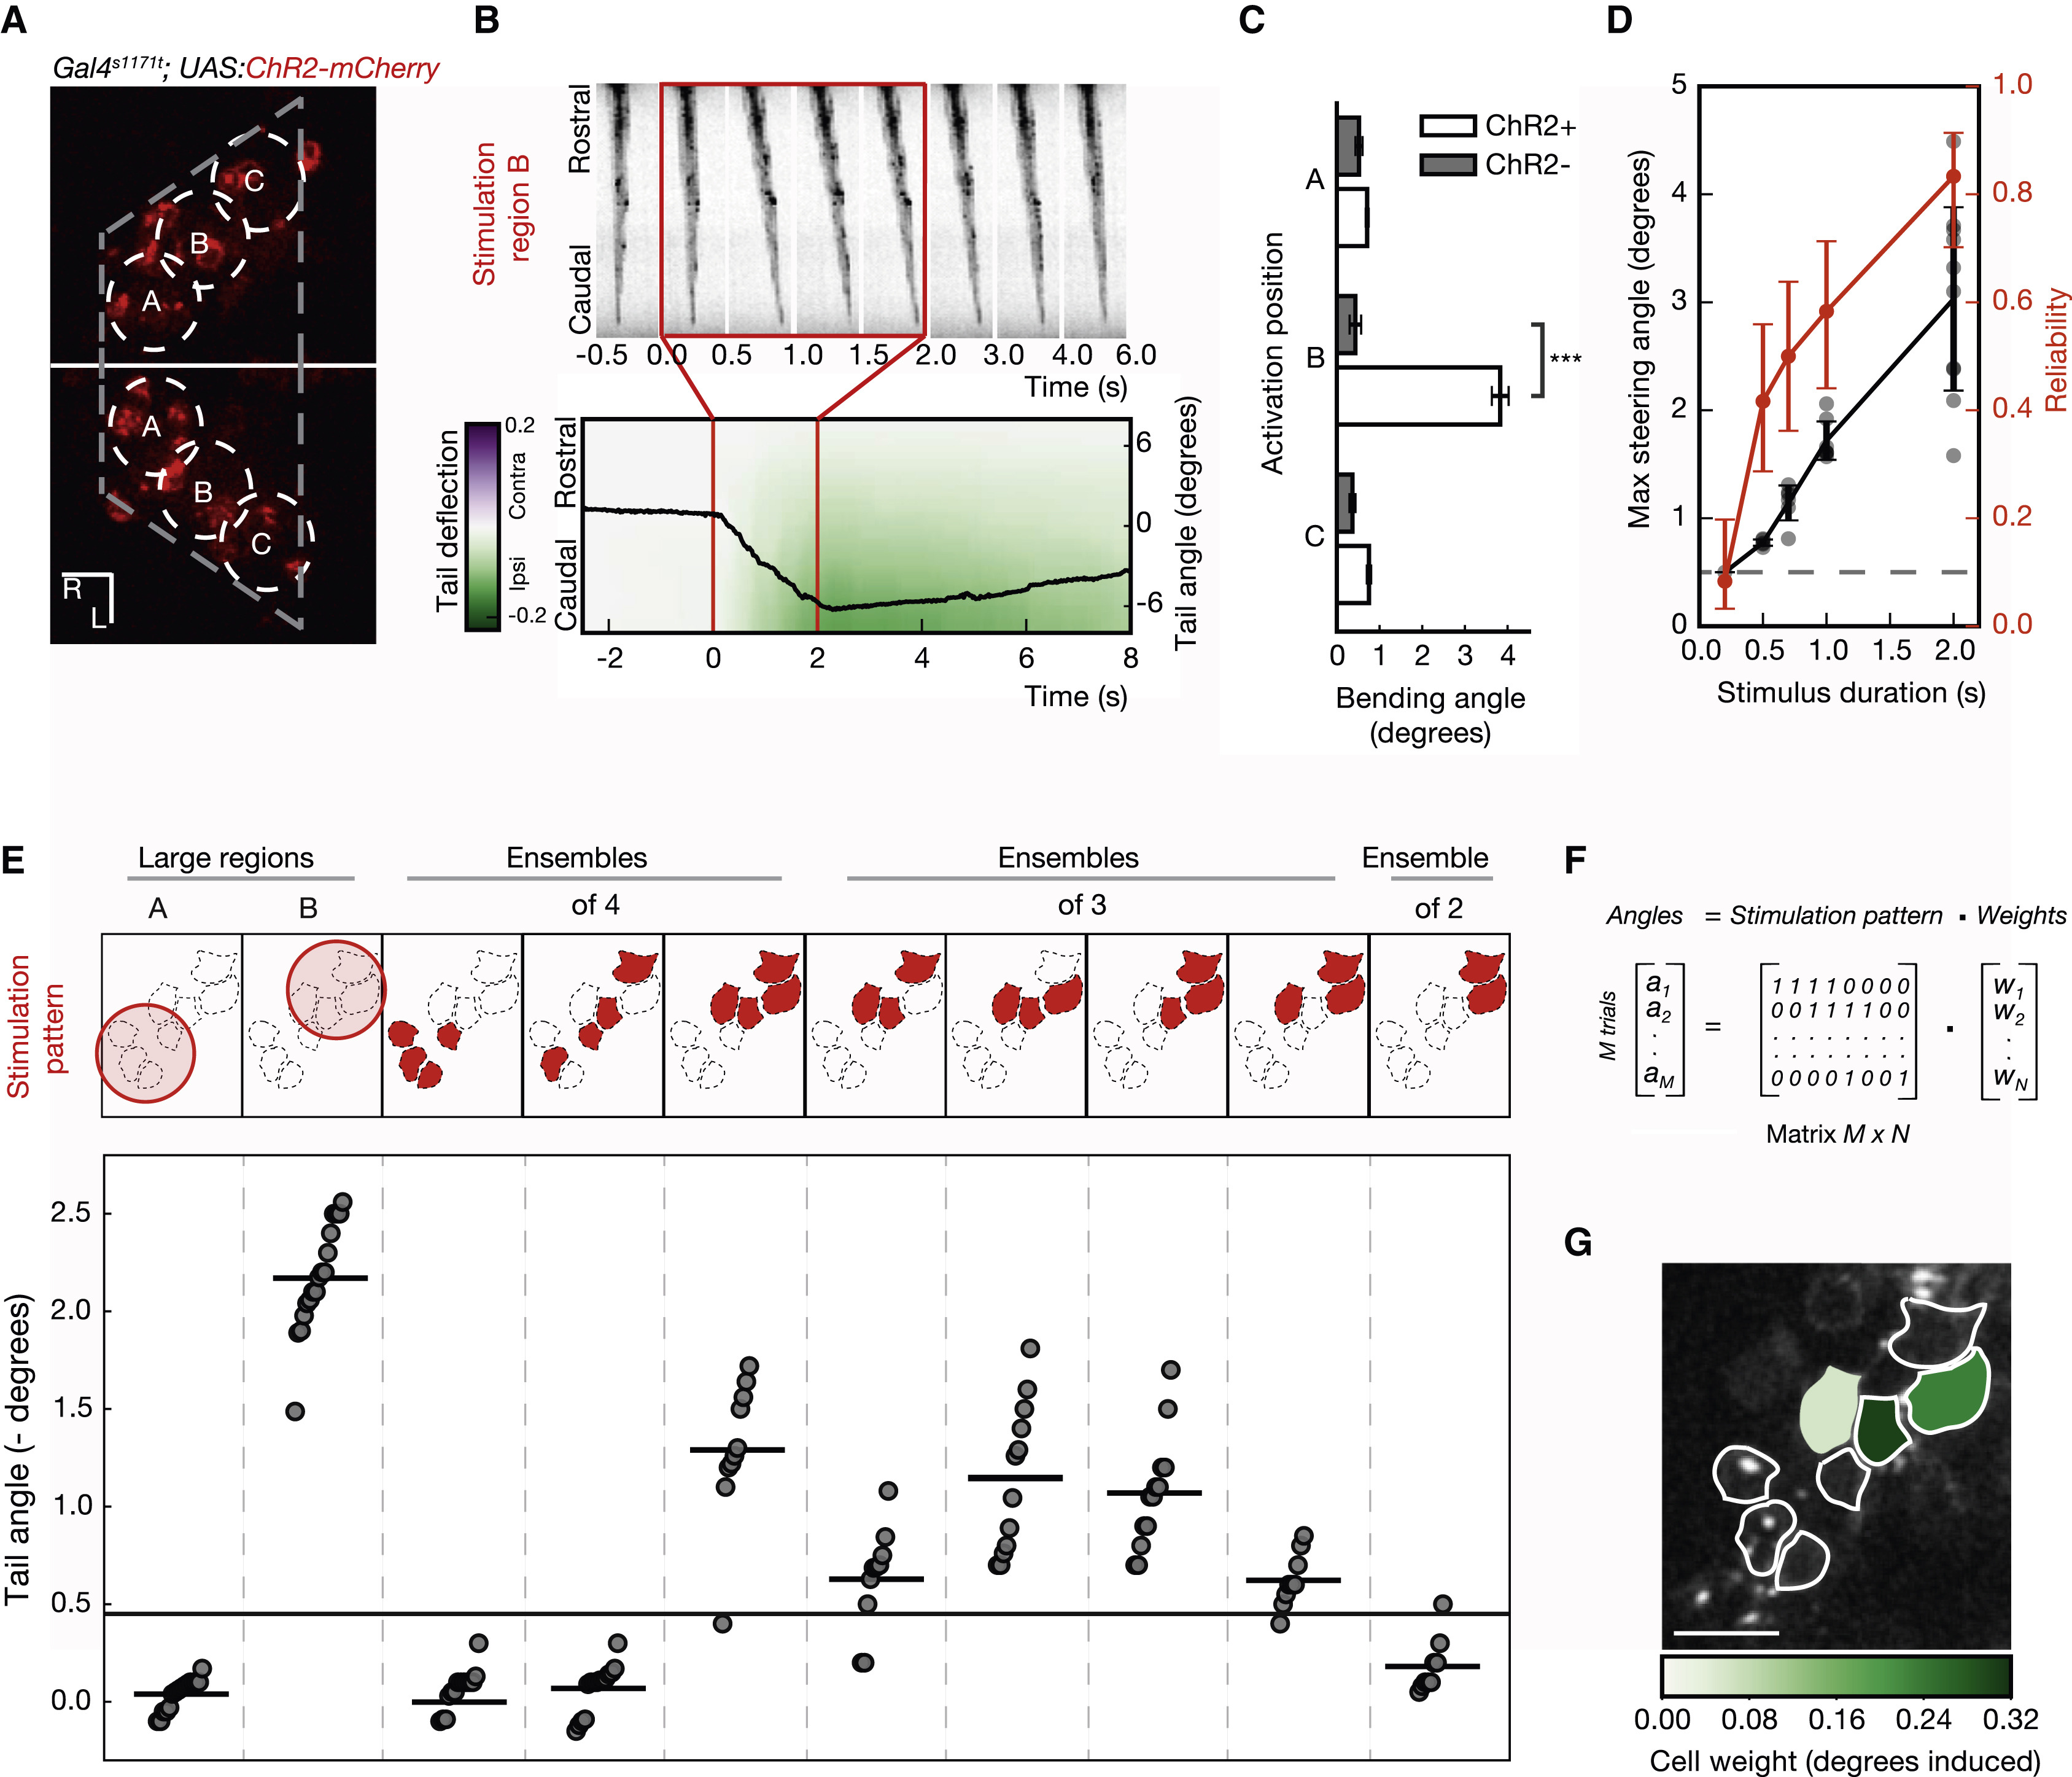
Functional Identification of Behaviorally Relevant Neurons
(A) Probing the neuronal substrates driving a motor outcome. Slightly overlapping photostimulation regions, 18 μm in diameter, were targeted in fish expressing ChR2-mCherry in the nMLF for an initial characterization of the circuit.
(B) Kinematics of the induced tail bending. When position B is targeted, a slow ipsilateral deflection of the tail is detected, followed by relaxation to the baseline level at the end of stimulation. The angle between the base and the caudal tip of the tail is shown as a black line, overlaid onto a heatmap, which shows the relative lateral deflection along the tail.
(C) Comparison of the maximum tail bending angle induced by 2P photostimulation of different regions. The difference in deflection angle is only significant for region B (p value < 0.001; Welsh’s t test; Bonferroni corrected; n = 15 trials across six fish for ChR2+; n = 12 trials across four fish for ChR2−). Error bars indicate SEM.
(D) The influence of photostimulation duration on behavior. Stimulations longer than 200 ms lead to tail deflection (judged as a deflection angle greater than five SDs of the baseline). Increasing the duration of the photostimulations causes tail bending in a larger fraction of trials (red) and larger amplitude tail deflections (black). Error bars indicate the SD.
(E) Behavior-based identification of neurons driving tail bends. From the regions used for initial mapping, smaller subsets of neurons are iteratively selected for stimulation, based on the induced behavior magnitude (tail angle). This procedure, reducing trial after trial the number of units probed, converges to minimal selections of neurons that significantly drive behavior (at least five SDs above baseline—black horizontal line).
(F) Model for neuron contribution to behavior. The magnitude of the tail angle (angles) induced in every trial is expressed as linear combination of the neurons included in the pattern (0, excluded; 1, included) and the contribution/weight of each neuron (weights).
(G) Weight map of behavior. A regularized regression on the model in (F) is used to fit the behavior data. This returns a map with the contribution in degrees from each stimulated cell to the behavioral outcome. The scale bars represent 10 μm.