
|
Fig. 1
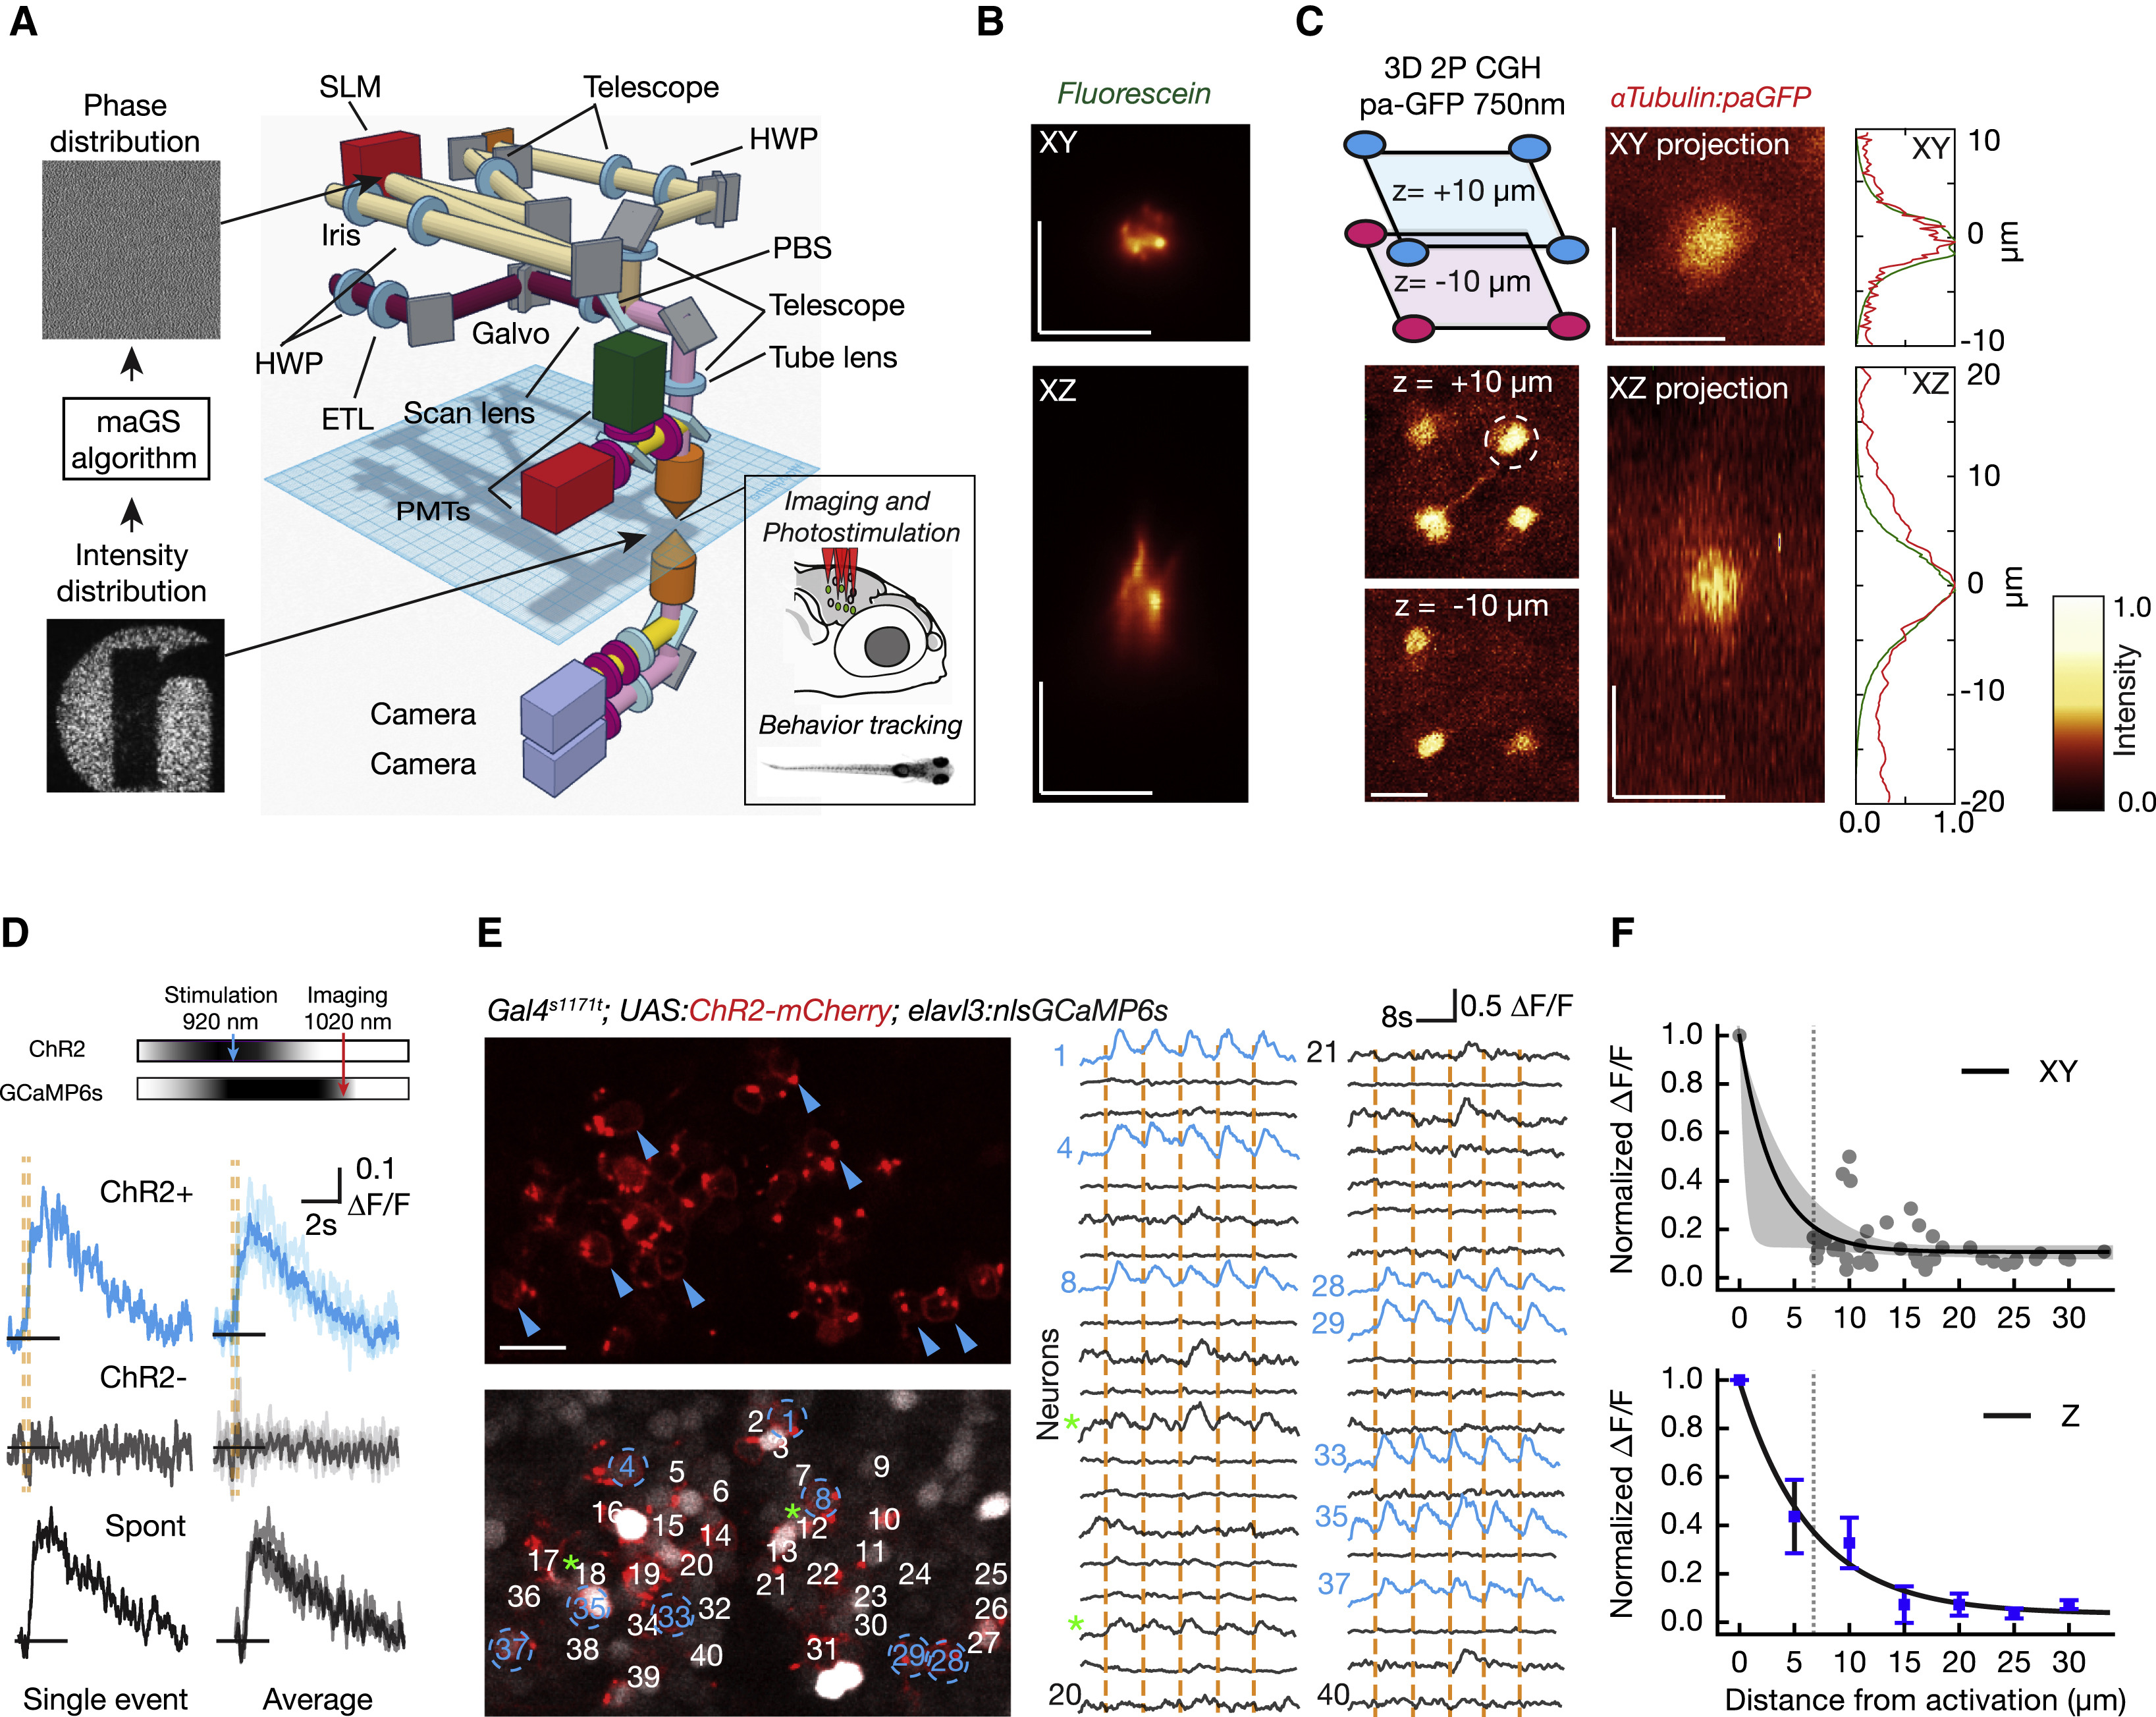
Parallel 2P Optogenetic Stimulation and Activity Readout
(A) Complex illumination patterns are obtained in the sample volume using computer-generated holography (CGH). A fast Fourier transform (FFT)-based algorithm (maGS) calculates the phase modulation that generates the desired pattern at the sample plane (logo of our institute). The photostimulation path (light brown) uses a spatial light modulator (SLM) (red) to apply phase corrections. The imaging path (magenta) includes an electrically tunable lens (ETL) for remote focusing. The two paths are combined with a polarizing beam splitter (PBS) (details in Figure S1 and STAR Methods).
(B) Measurement of the excitation profile obtained from a thin fluorescein layer illuminated with a circular spot 6 μm in diameter.
(C) Parallel 2P activation of paGFP in vivo using a 3D excitation pattern with a distribution of circular ROIs (6 μm in diameter). The photoactivation foci are generated in the optic tectum at a depth of about 100–120 μm in a zebrafish larva with pan-neuronal paGFP expression (alpha-tubulin:paGFP). Four spots are generated at +10 μm and three spots at −10 μm. Axial and lateral average projections of a photoactivation volume obtained in vivo with a target pattern 6 μm in diameter are shown. The paGFP profiles (FWHM: 5.79 ± 0.91 μm laterally and 8.9 ± 0.9 μm axially) were photoactivated at 750 nm with a power of 0.25 mW/μm2 at the sample for 0.5 s. The right panel shows a comparison of the fluorescence profile measured for paGFP photoconversion (in red) and for a fluorescein layer (in green).
(D) Somatic GCaMP6s signals induced by 200 ms photostimulation at 920 nm while imaging at 1,020 nm. Cells expressing ChR2 and GCaMP6s show stimulation-induced calcium increases (blue traces) whereas cells expressing only GCaMP6s (gray traces) do not. Activation events in targeted neurons show similar response dynamics to spontaneous events (black traces; Figures S6A and S6B).
(E) Parallel neuronal stimulation in vivo. A small network of neurons is imaged during repeated simultaneous photostimulation of eight targeted neurons (in blue). Photostimulation events (200 ms) are indicated by orange vertical lines, and the traces for photostimulated neurons are in blue. Along with the targeted neurons, some cells show low-amplitude activity locked to the stimulation (green asterisk; see also Figures S6E and S6F).
(F) Effective photostimulation resolution. To measure lateral resolution, targeted cells were photostimulated while nearby neurons in the same imaging plane were recorded. Each gray dot represents a non-targeted cell, with ΔF/F normalized relative to the response in the targeted cell. An exponential decay fit is shown (black line) with 95% confidence interval (bootstrap; shown in gray). The thin dashed line shows the minimum distance between cells in this region of the brain. To measure axial (Z) resolution, the imaging plane was shifted axially from the target with the ETL. An example of the protocol is shown in Figures S6G and S6H. Induced ΔF/F is normalized relative to the photostimulated target cell. In blue, an exponential fit is shown, and error bars indicate the SEM. The scale bars represent 10 μm.