
|
Fig. 4 S1
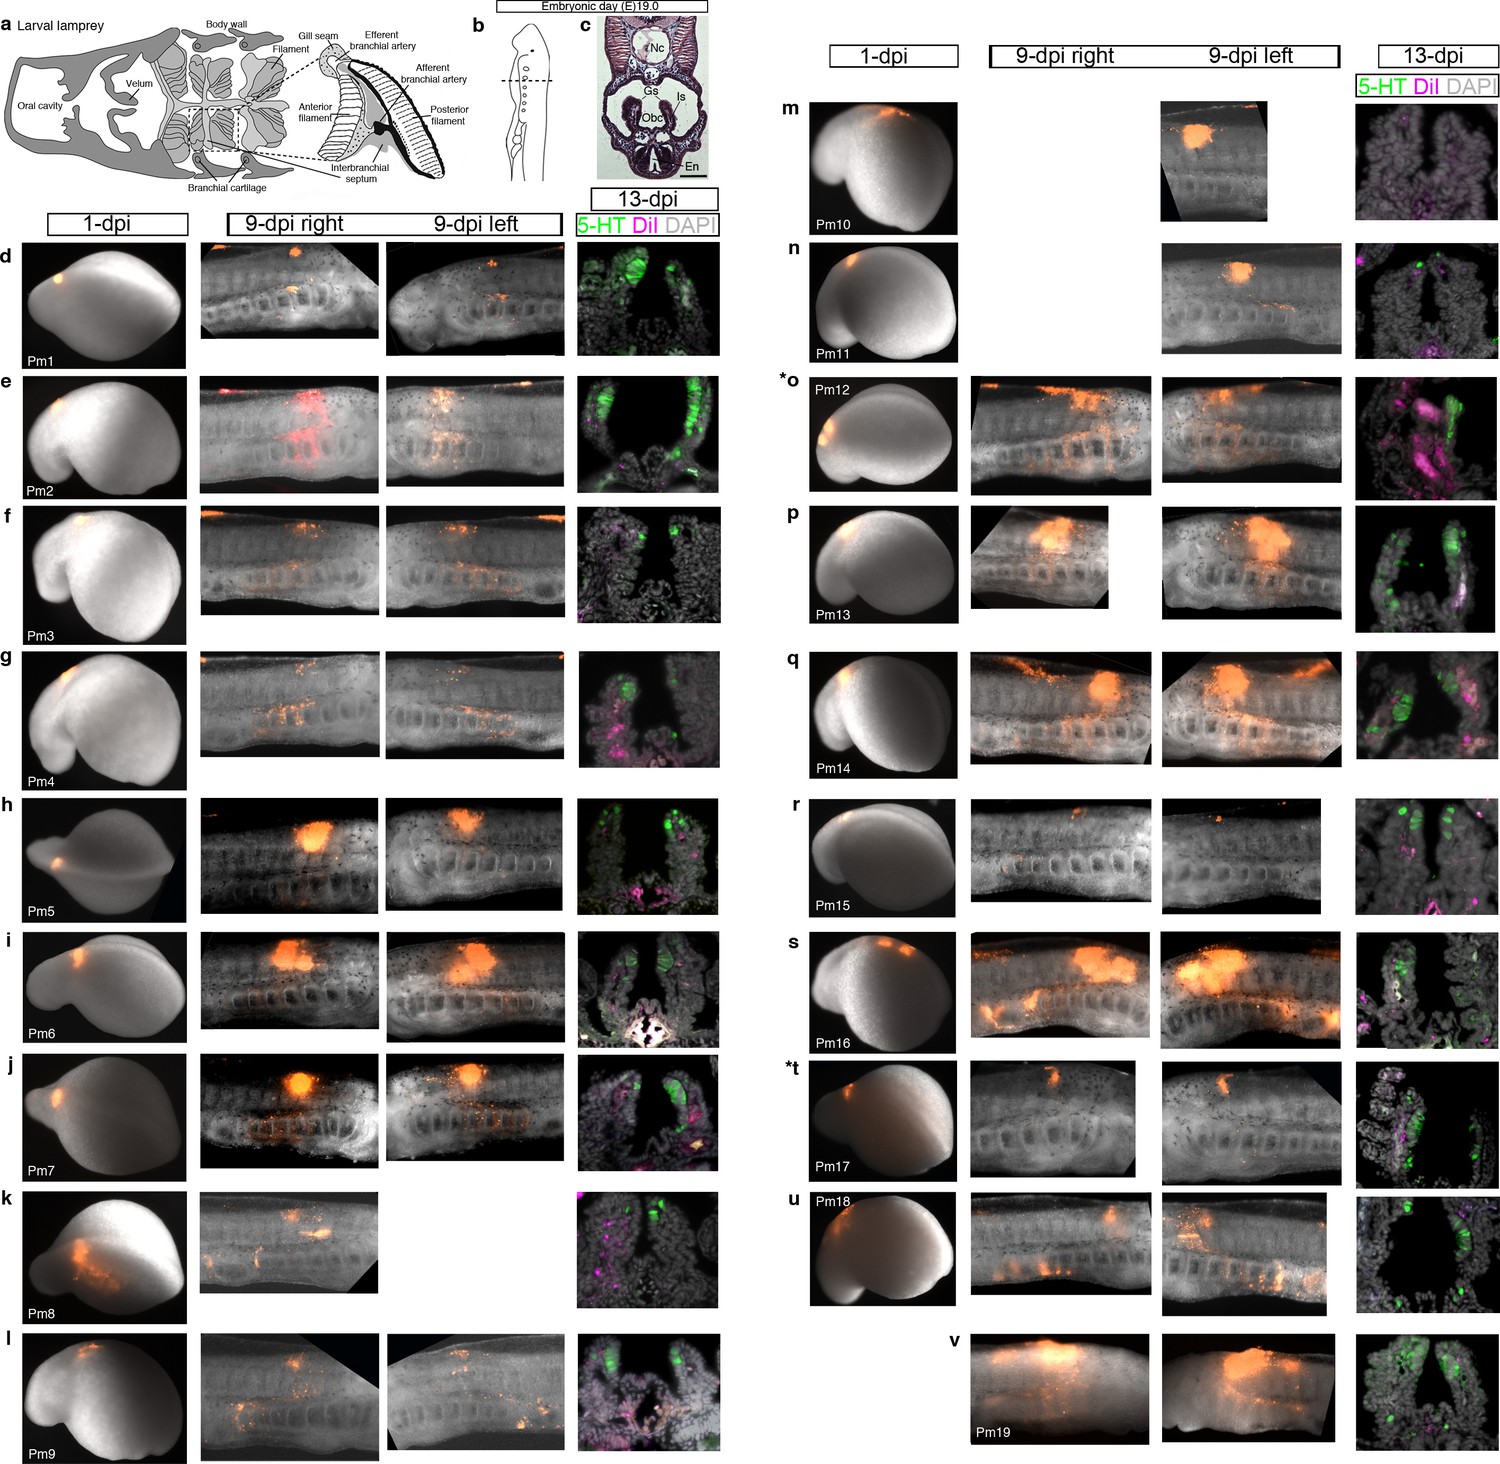
Confirmation of successful targeting of pharyngeal arch-destined neural crest cells in all lamprey embryos analyzed for neural crest contribution to putative NECs.
For orientation, the first three panels are repeated from Figure 4. (a) Schematic larval lamprey section (modified from Barreiro-Iglesias et al., 2009) showing gill pairs in the orobranchial cavity, supported byan interbranchial septum. (b) Schematic Piavis-stage 17 (E19) lamprey (modified from Tahara,1988). Dotted line: section plane. (c) Hematoxylin and eosin staining shows internal gills as ‘stalks’ within the orobranchial cavity. (d–v) Each row shows one of the 19 lamprey embryos with DiI-labeled neural crest derivatives near serotonergic putative NECs at the final analysis. The first panel shows the site of DiI injection at one day post-injection (dpi) (missing for embryo Pm19); the second and third panels show DiI-labeled neural crest cells in the branchial arches in right and/or left-side views at 9-dpi; the fourth panel shows a view of the internal gills in section at 13-dpi (for section plane, see dotted line in panel a), showing DiI contribution to gill support cells, but not to the putative NECs (serotonergic cells) in the gill epithelium. Asterisks indicate the embryos from which data are shown in Figure 4 (Pm12 and Pm17). 5-HT, serotonin; En, endostyle; Gs, gill seam; Is, interbranchial septum; Nc, notochord; Obc, orobranchial cavity.