
|
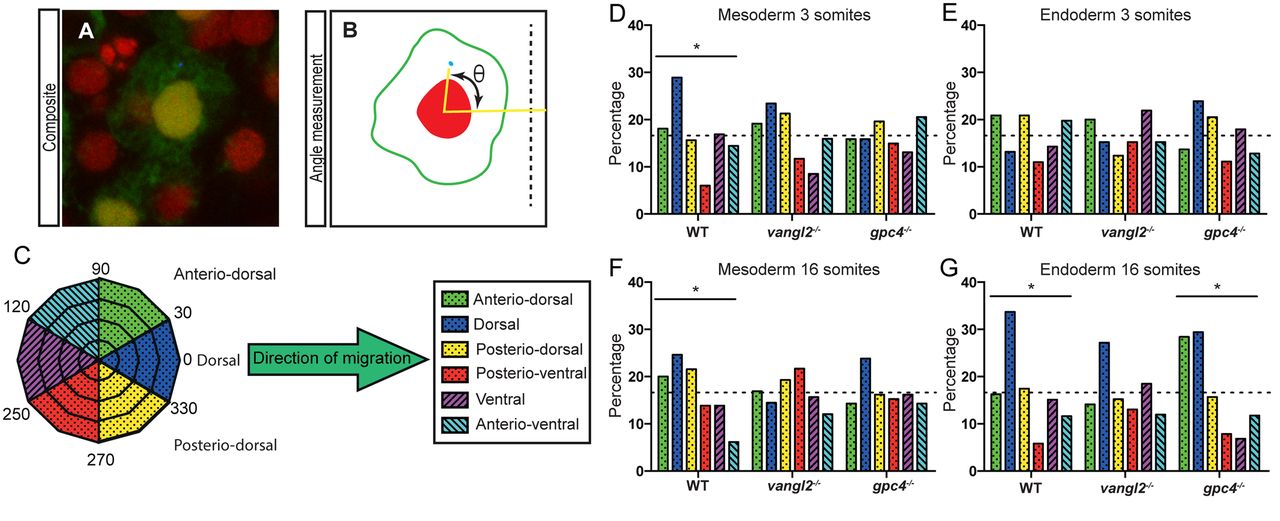
Fig. 3
MTOC distribution of mesoderm and endoderm during somitogenesis stages. (A) Composite confocal micrograph demonstrating an EGFP-positive endoderm cell with red nucleus and blue MTOC. (B) Schematic angle measurement (θ) of the MTOC relative to the centre of the nucleus and the dorsal midline (dotted line). (C) Schematic highlighting the grouping of MTOC data into six direction groups. (D-G) Graphs showing the percentage of MTOC in each of the six segments. (D) Mesoderm 3 somites stage. (E) Endoderm 3 somites stage. (F) Mesoderm 16 somites stage. (G) Endoderm 16 somites stage. Dotted line indicates equal (randomised) mean value. Asterisk represents significant difference by χ squared test, *P≤0.05. See Table S1 for χ squared values testing for equal MTOC distributions over the six segments (null hypothesis is randomised data) and with wild type observed values as expected values (null hypothesis is data matching wild type). See Table S2 for cell number and embryo number analysed.