
|
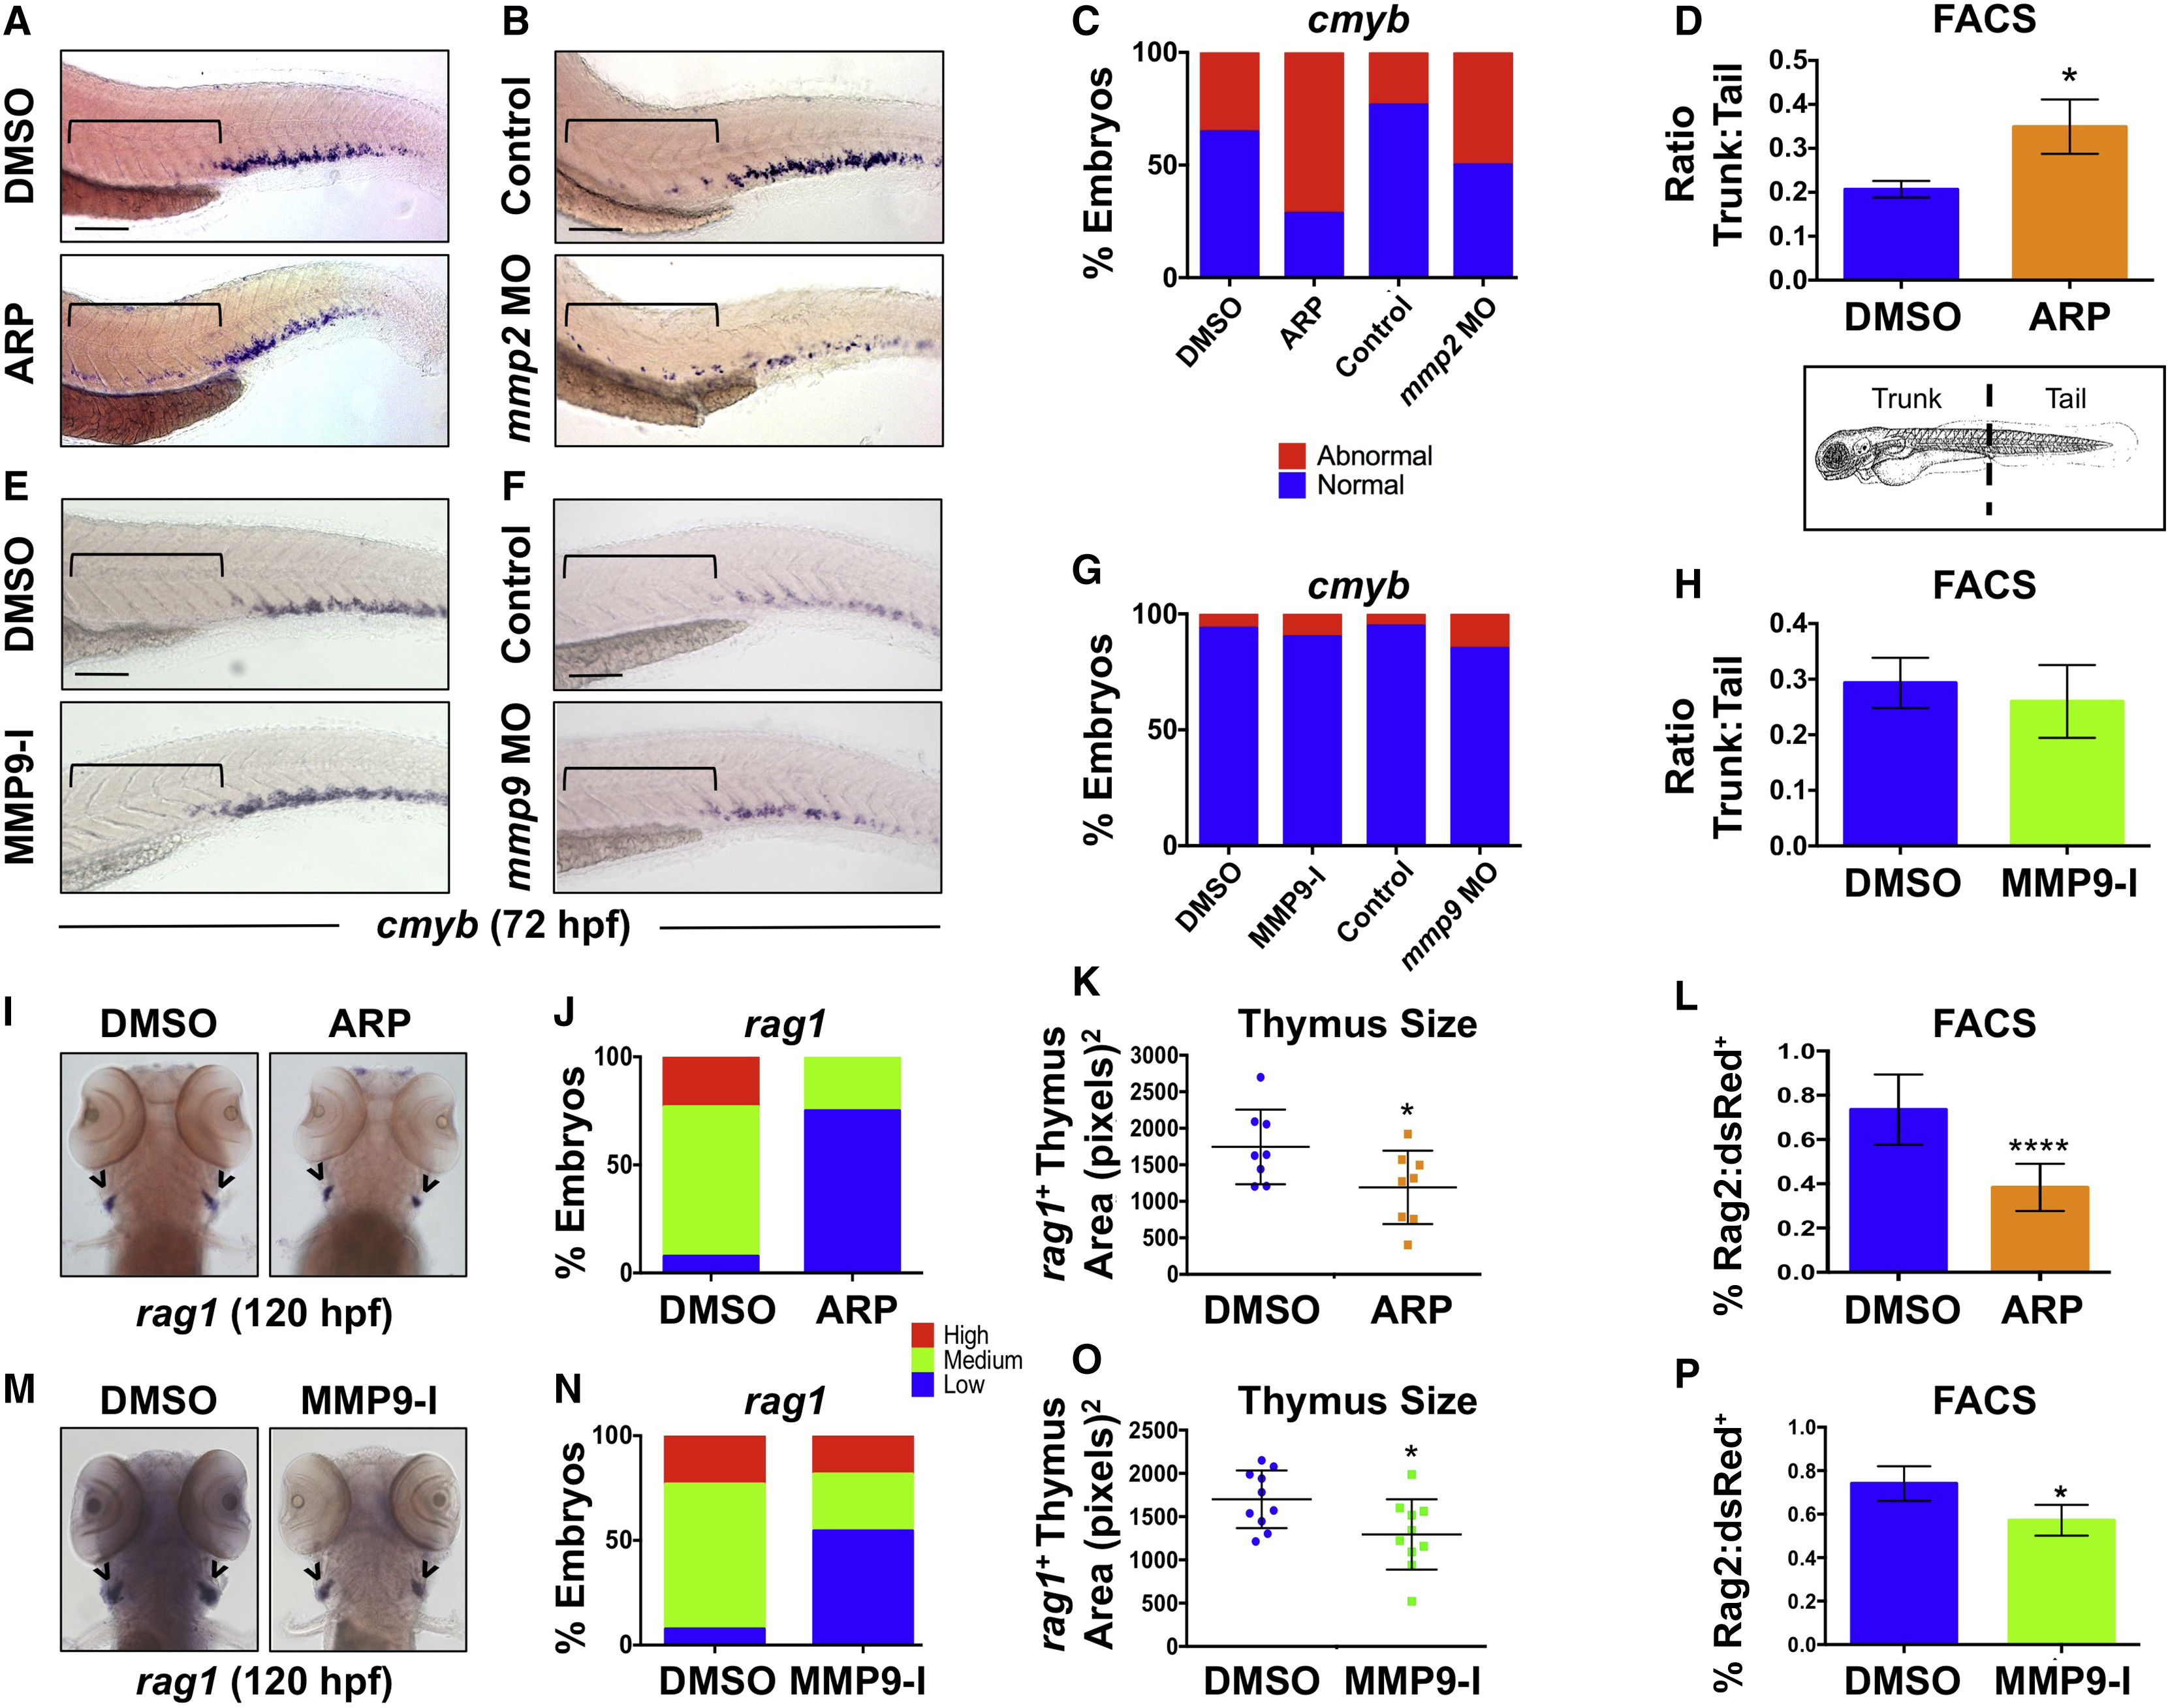
Fig. 5
Gelatinases Play Distinct Roles in HSPC Colonization of the CHT and Thymus
(A) ARP exposure (12–72 hpf) caused abnormal cmyb expression in the AGM. Brackets mark anterior/posterior extent of AGM region.
(B) mmp2 morphants phenocopied the effect shown in (A) at 72 hpf.
(C) Qualitative phenotypic distribution of embryos from (A) and (B) scored for abnormal retention of cmyb+ HSPCs in the AGM at 72 hpf (n ≥ 20 embryos/condition).
(D) FACS analysis of Flk1:dsRed+/cMyb:GFP+ HSPCs showed a significant enrichment in the ratio of trunk to tail HSPCs in ARP-exposed embryos at 72 hpf (10 embryo sections/sample, 5 replicates/condition; ∗p < 0.05).
(E) MMP9-I exposure (5 μM, 12–72 hpf) did not cause maintenance of cmyb AGM expression at 72 hpf.
(F) mmp9 morphants had normal levels of cmyb in the AGM at 72 hpf.
(G) Qualitative phenotypic distribution of embryos from (E) and (F) scored for cmyb+ HSPCs in the AGM at 72 hpf (n value and scoring as in C).
(H) FACS analysis of Flk1:dsRed+/cMyb:GFP+ HSPCs showed no change in the trunk-to-tail ratio of HSPCs in MMP9-I-treated embryos at 72 hpf (10 embryo sections/sample, 5 replicates/condition).
(I) ARP exposure from 12 to 120 hpf decreased thymic rag1+ expression.
(J) Qualitative phenotypic distribution of embryos from (I) scored with low, medium, or high thymic rag1+ expression at 120 hpf (n ≥ 20/condition).
(K) ImageJ measurement of rag1+ thymus area revealed a significant decrease in thymus size with Mmp2 inhibition (12–120 hpf) (n = 8/condition; ∗p < 0.05).
(L) FACS for Rag2:dsRed+ lymphoid progenitors showed a significant decrease with Mmp2 inhibition (12–120 hpf) (5 embryos/sample, >3 replicates/condition; ∗∗∗∗p < 0.0001).
(M) MMP9-I exposure from 12 to 120 hpf decreased thymic rag1+ expression.
(N) Qualitative phenotypic distribution of embryos from (M) scored for rag1 expression in the thymus at 120 hpf (n value and scoring as in J).
(O) ImageJ measurement of rag1+ thymus area revealed a significant decrease in thymus size with Mmp9 inhibition (12–120 hpf) (n = 10/condition; ∗p < 0.05).
(P) FACS for Rag2:dsRed+ lymphoid progenitors showed a significant decrease with Mmp9 inhibition (12–120 hpf) (5 embryos/sample, >3 replicates/condition; ∗p < 0.05).
Arrowheads in (I and M) mark paired thymii. Error bars denote mean ± SD. Scale bars, 100 μm.