
|
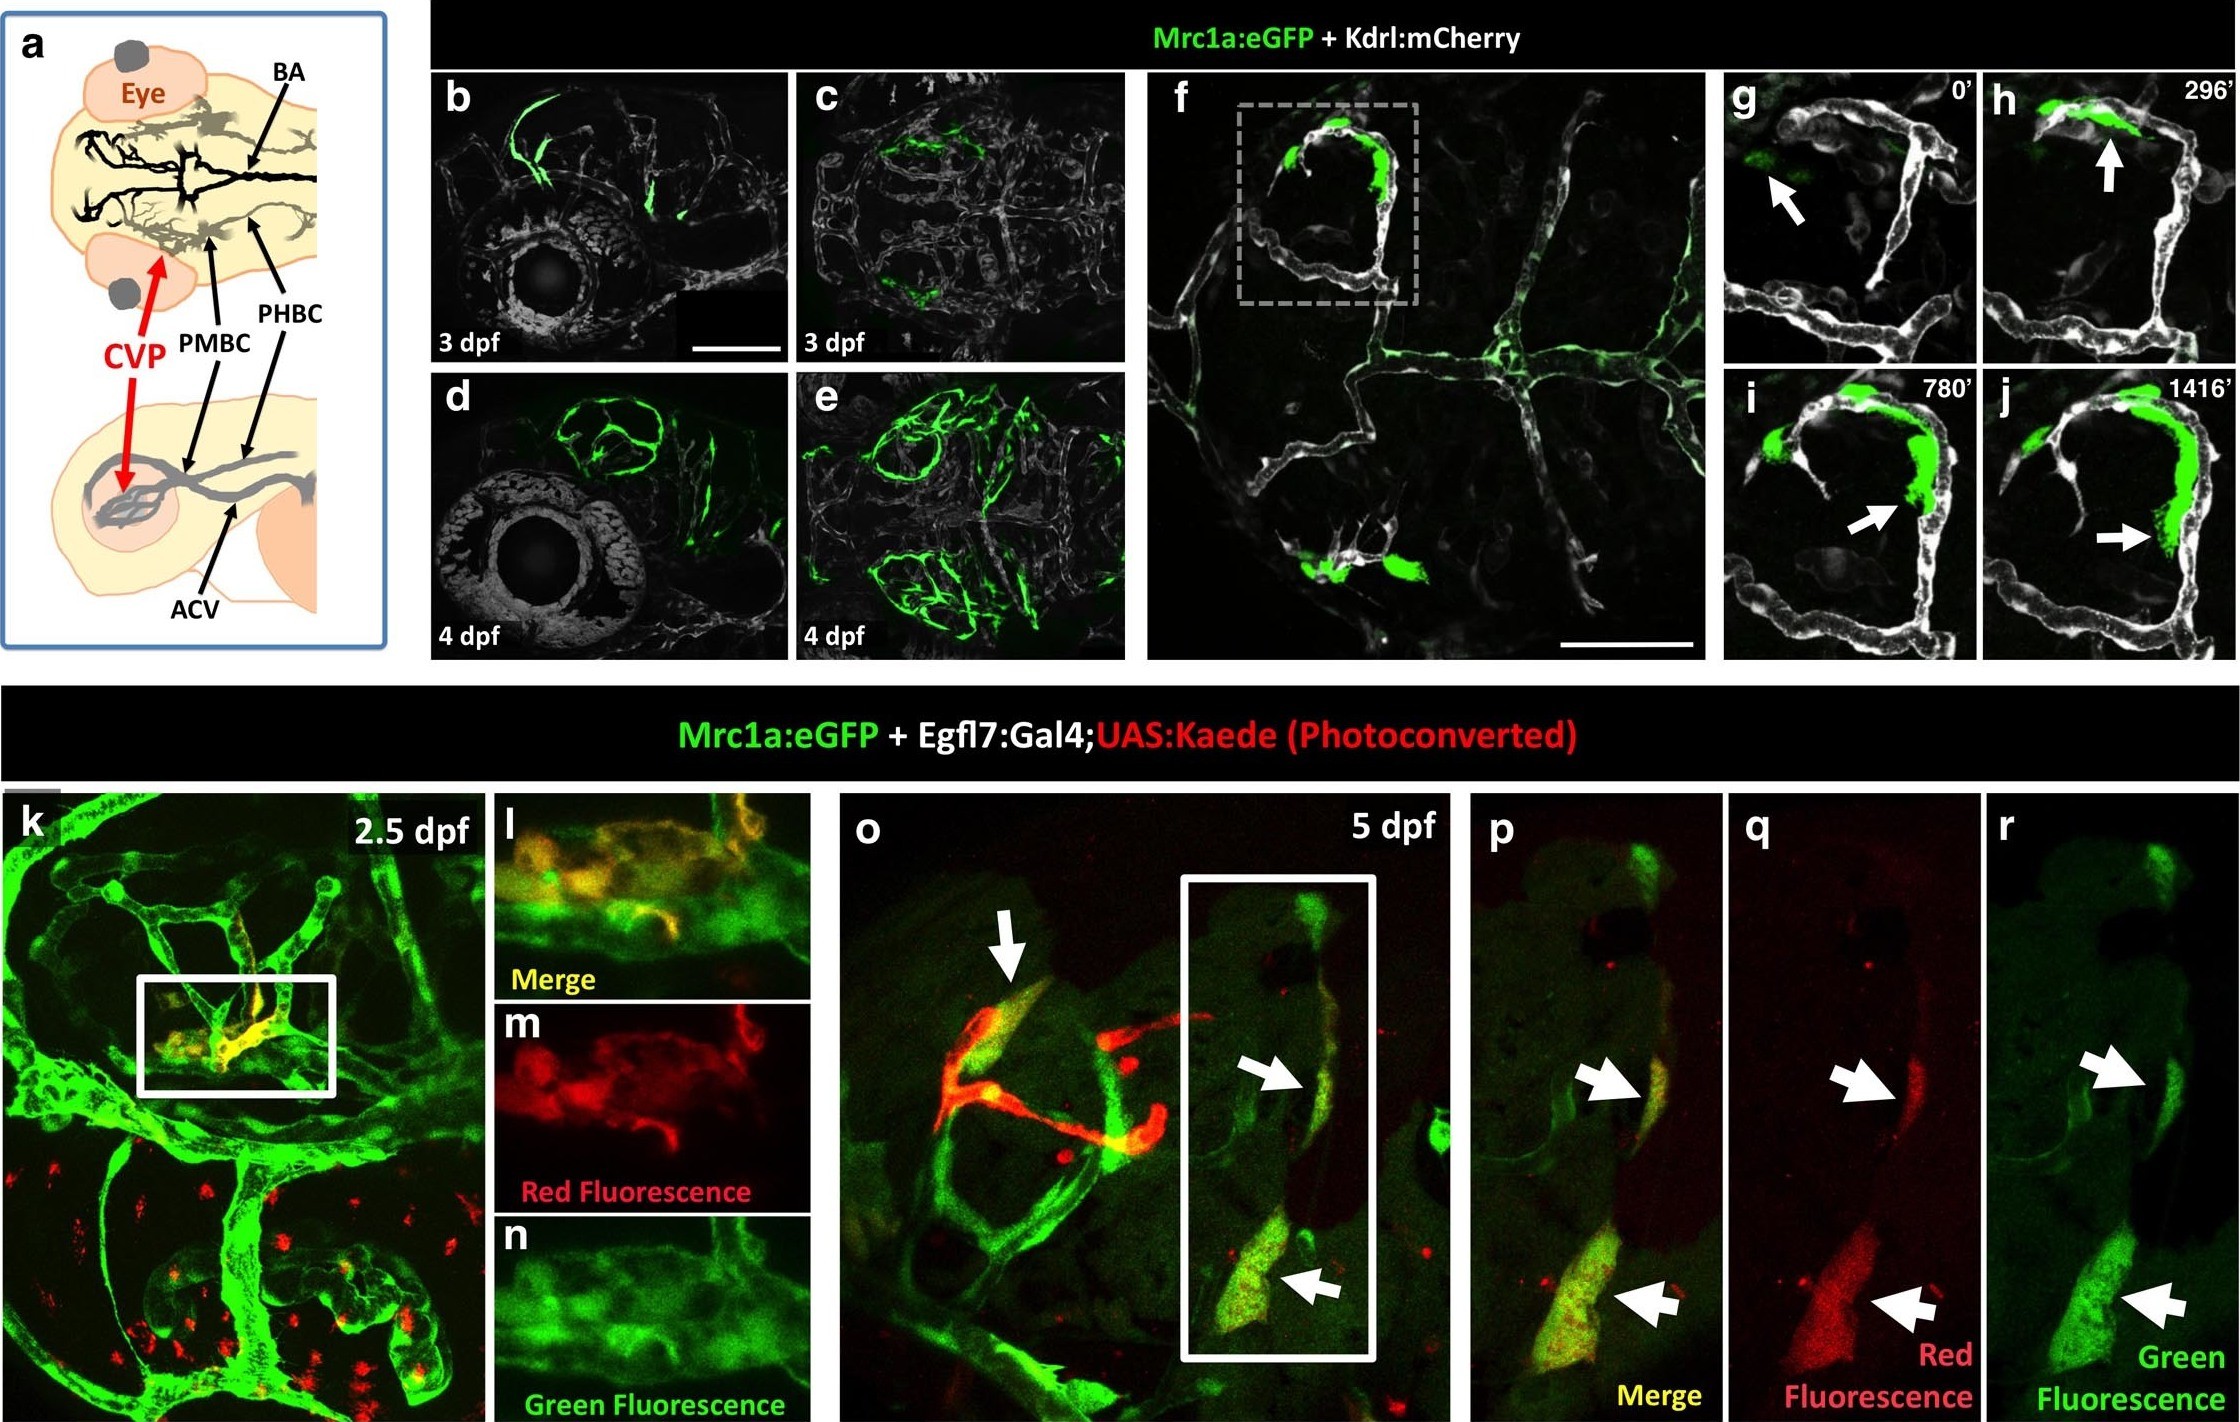
Fig. 7
Zebrafish FGPs emerge from the endothelium of the choroidal vascular plexus.
(a), Dorsal (top) and lateral (bottom) view schematic diagrams of approximately 2.5 dpf zebrafish heads with some of their associated vasculature, especially major venous tracts. CVP, choroidal (optic choroidal) vascular plexus; PMBC, primordial midbrain channel; PHBC, primordial hindbrain channel; BA, basilar artery. Adapted from Figure 5B in the Vascular Anatomy of Zebrafish Atlas (Isogai et al., 2001) – see this reference for additional details. (b–e) Confocal images of Mrc1a:eGFP-positive FGPs (green) and Kdrl:mCherry-positive blood vessels (grey) on the surface of the brain in 3 dpf (b,c) and 4 dpf (d,e) Tg(mrc1a:eGFP);Tg(kdrl:mCherry) double-transgenic zebrafish. b and d are lateral views, c and e are dorsal views of the head with rostral to the left. Some residual blood vessel GFP fluorescence was deleted for clarity; see Figure 7—figure supplement 1 4a–d for the original unmanipulated green/magenta images. (f–j) Confocal time lapse imaging of Mrc1a:eGFP-positive (green) FGPs migrating dorsally then medially along Kdrl:mCherry-positive (magenta) blood vessels on the surface of the brain in a 2.5–3 day old Tg(mrc1a:eGFP);Tg(kdrl:mCherry) double-transgenic zebrafish. Panel f shows an overview dorsal image from the 780’ minute time point (h). Panels g-j show magnified views of the boxed region in panel f at 0, 296, 780, and 1416 min time points. (k–n) Dorso-lateral view of a 2.5 dpf Tg(egfl7:gal4);Tg(UAS:Kaede);Tg(mrc1a:eGFP) triple-transgenic embryo readily after photoconverting the OCVP (k, white box). Red dots in k represent eye autofluorescent pigment. (l-n), Higher magnification of the photoconverted OCVP depicted in k (white box) showing expression of red photoconverted Kaede (l,m) and GFP (l,n). (o) Photoconversion on the OCVP results in red Kaede Mrc1a:eGFP-positive cells. Lateral view of a 5 dpf Tg(egfl7:gal4); Tg(UAS:Kaede); Tg(mrc1a:eGFP) triple-transgenic embryo (o) showing Red Kaede, Mrc1a-GFP-positive FGPs (white arrows) on the optic tectum (n = 8/12 embryos showed Red Kaede, with 1.25 ± 1.14 S.D. red FGPs per tectal neuropile).( p–r), Higher magnification views of the boxed region in panel o showing Mrc1a:eGFP (green, panels p and r) and photoconverted Kaede (red, panels p and q) double positive FGPs (white arrows). Rostral is to the left in all panels. Scale bars = 100 µm.