
|
Fig. 5 S2
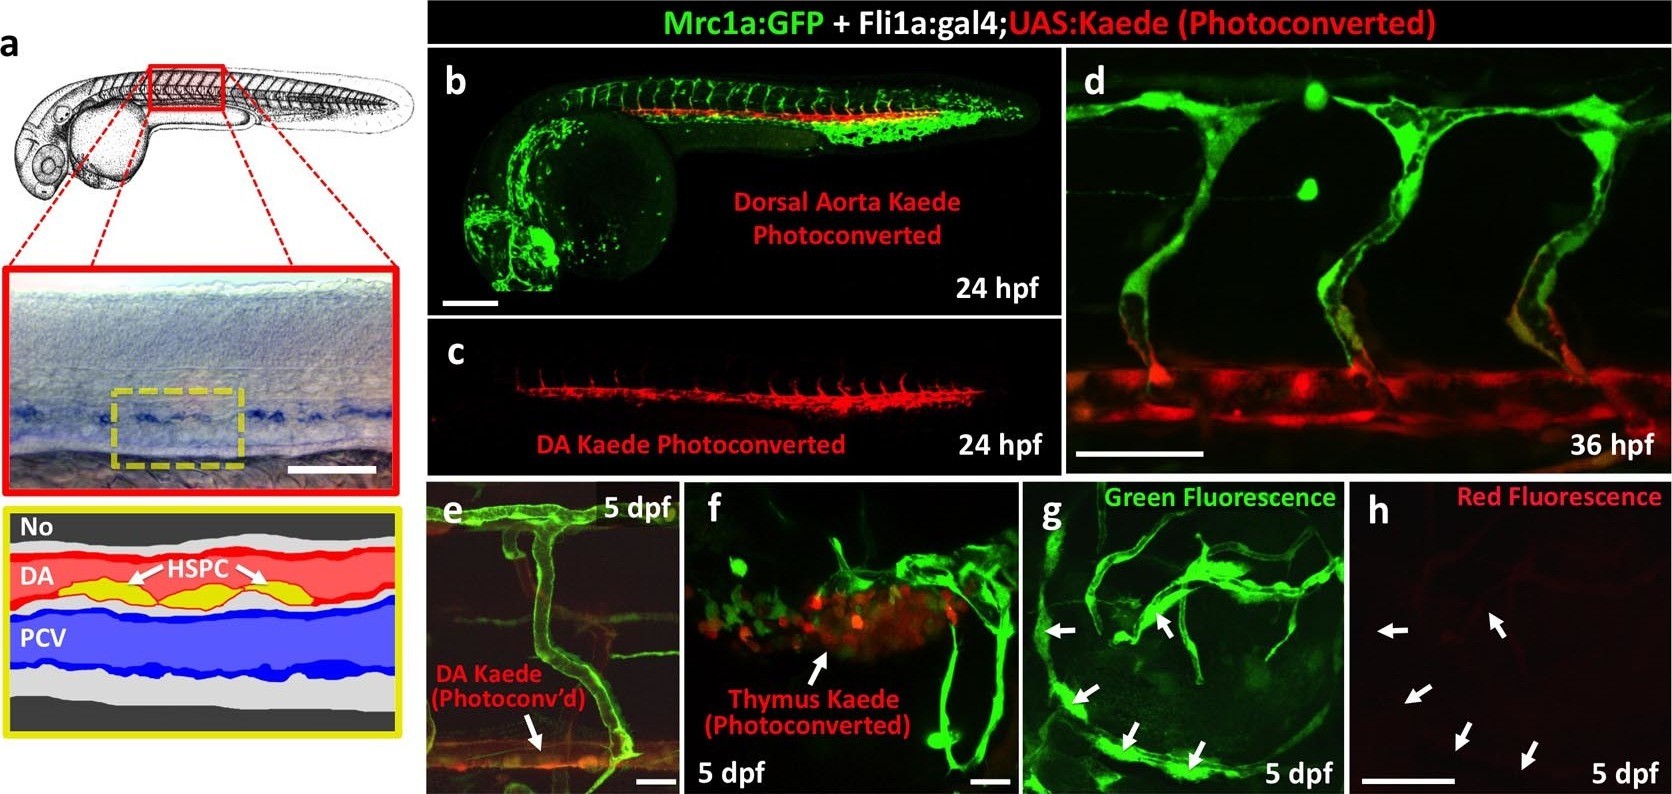
Zebrafish FGPs are not derived from definitive hematopoietic progenitors.
(a) Schematic diagram illustrating hematopoietic stem and progenitor cells (HSPCs) differentiation from endothelial cells in the ventral floor of the dorsal aorta (DA). No, Notochord; DA, Dorsal aorta; PCV, Posterior Cardinal Vein. (b–d) Green-to-red photoconversion of the DA in a 24 hpf Tg(fli:gal4);Tg(UAS:Kaede);Tg(mrc1a:eGFP) triple-transgenic embryo, showing red/green (b,d) or red only (c) confocal fluorescence images either immediately after photoconversion at 24 hpf (b,c) or 12 hr post-photoconversion at 36 hpf (d), (n = 6 animals photoconverted). (e–h) Confocal images of green (e–g) and red (e,f,h) fluorescence in the trunk vessels (e), thymus (f), and dorsal optic tectum FGPs (g,h) in a 5 dpf Tg(fli:gal4);Tg(UAS:Kaede);Tg(mrc1a:eGFP) triple-transgenic animal that had been subjected to DA photoconversion at 24 hpf. Arrows in panels e and f show readily apparent residual red fluorescence in the DA (e) and in the thymus (f). Arrows in panels g and h show Mrc1a:eGFP positive FGPs on the head (g) that are not red fluorescent (h), (n = 6/6 photoconverted animals lack red fluorescent FGPs).