
|
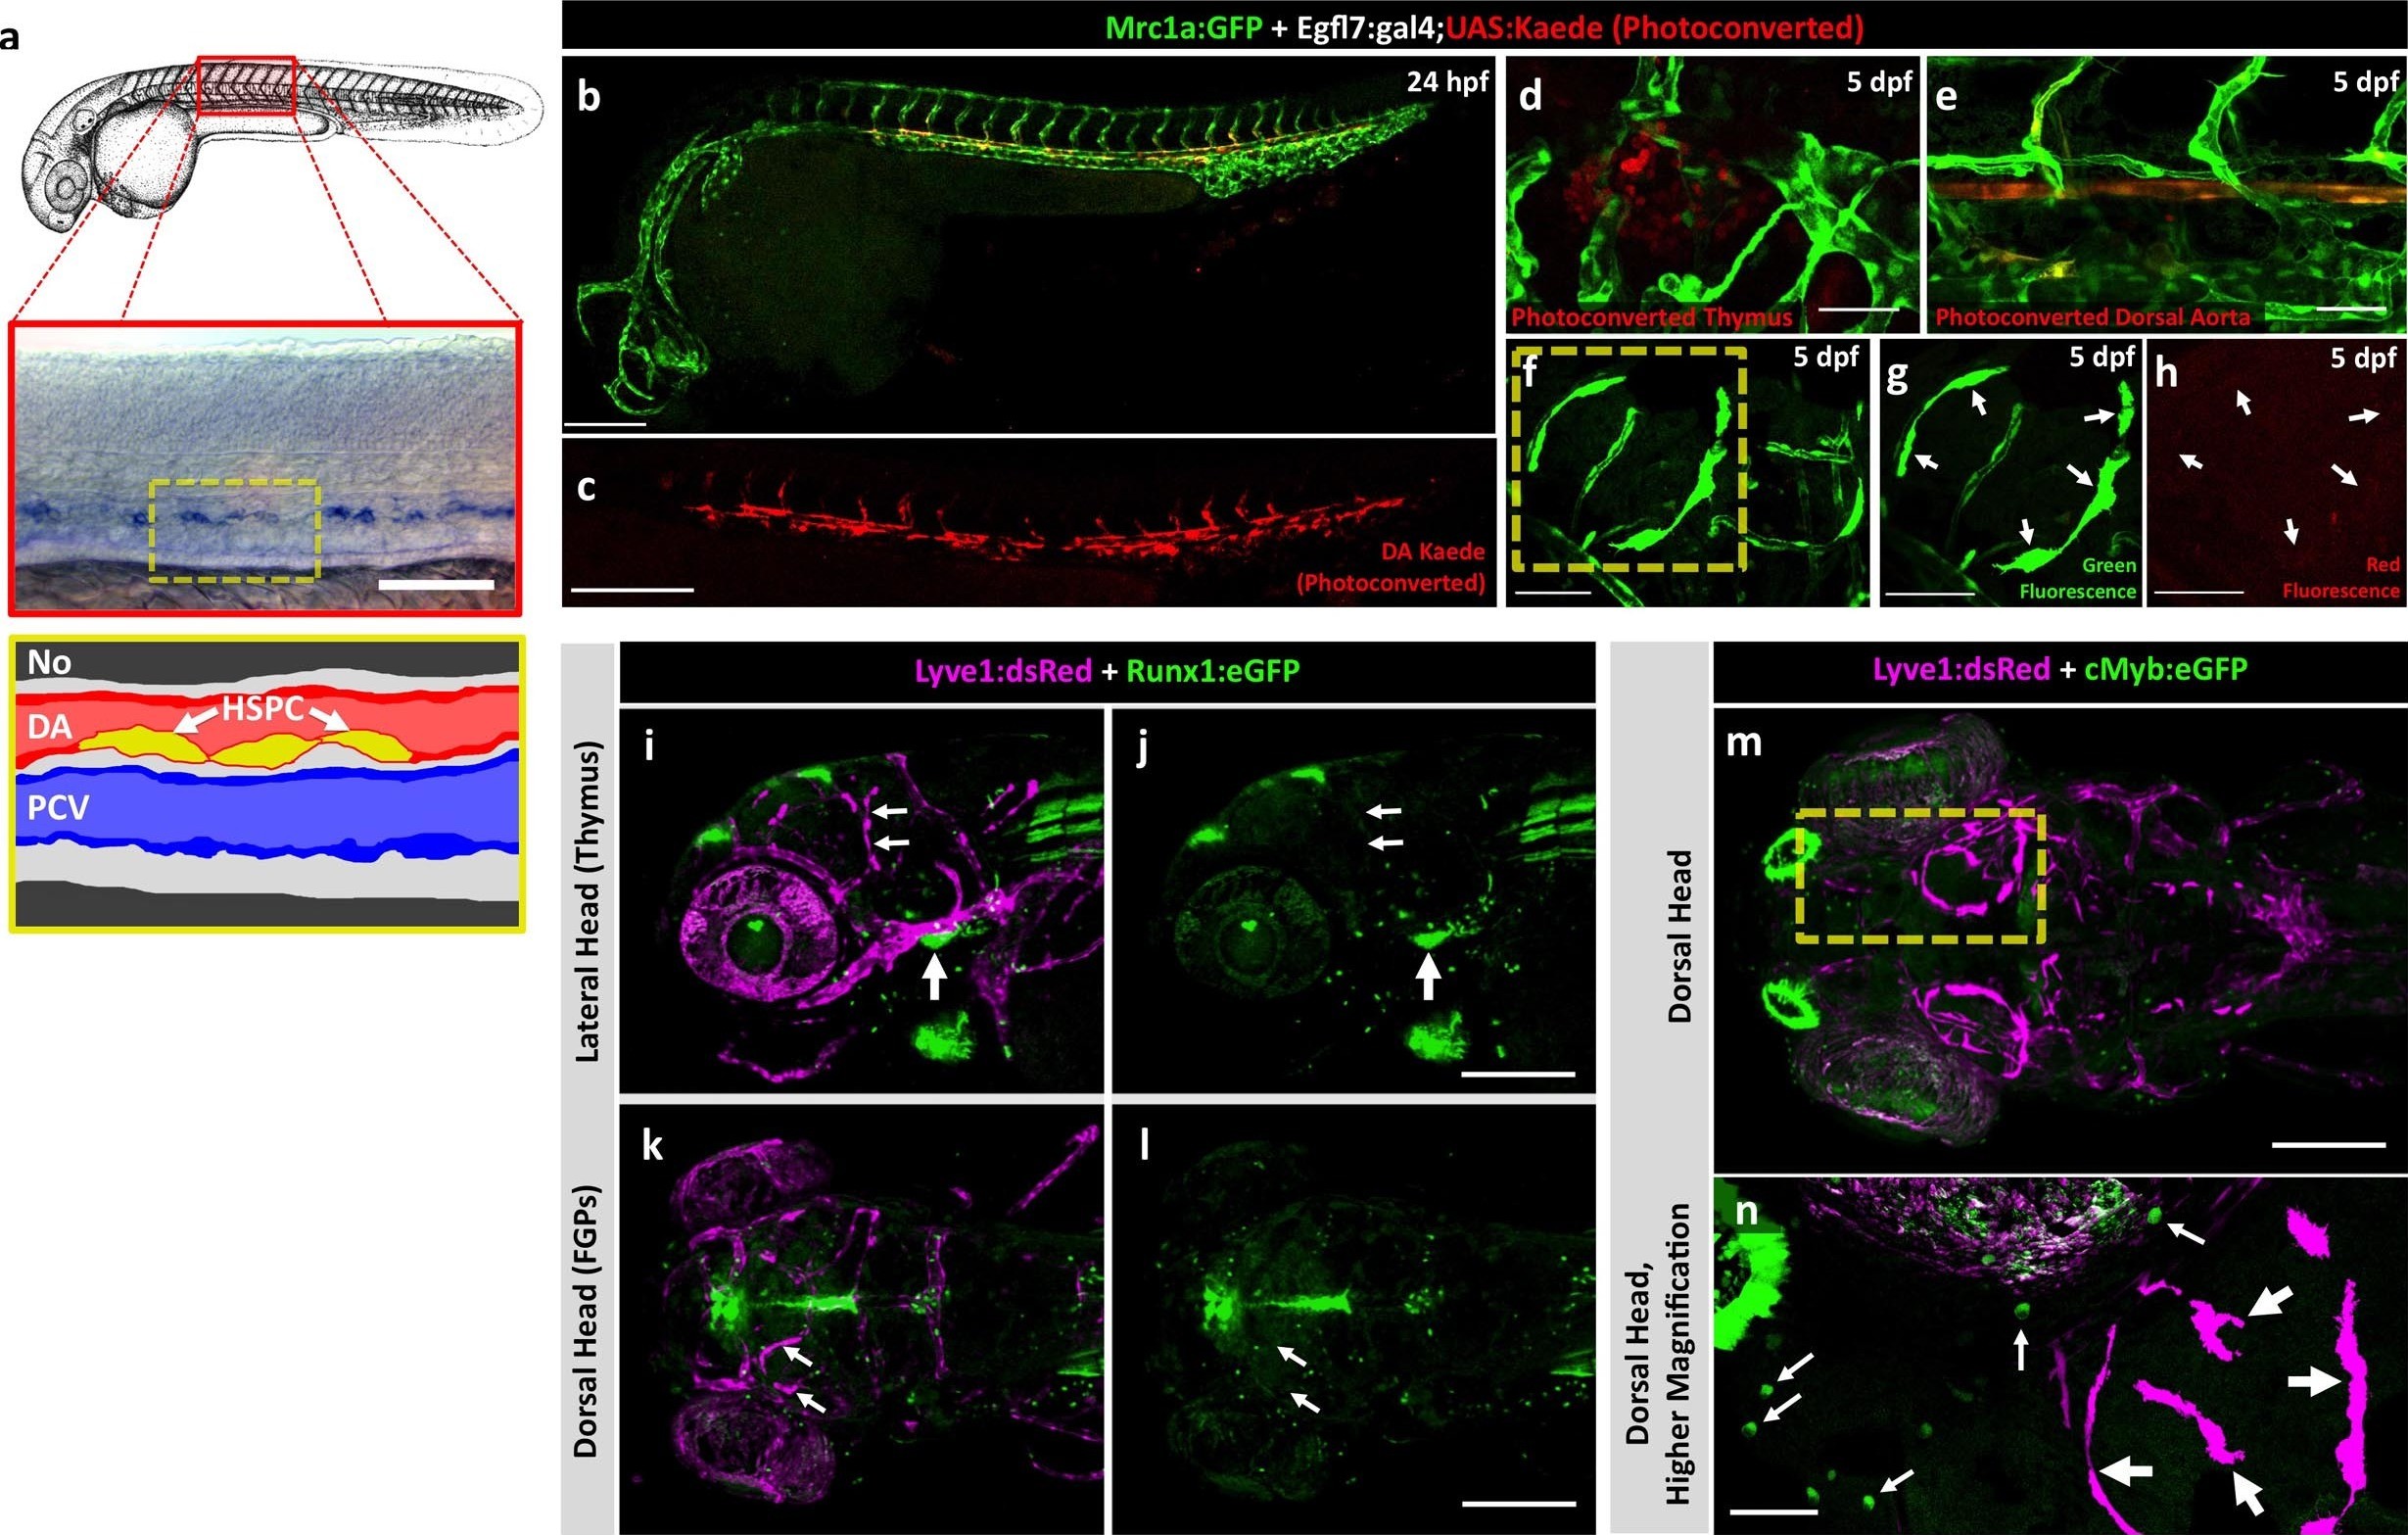
Fig. 5
Zebrafish FGPs are not derived from definitive hematopoietic progenitors.
(a) Schematic diagram illustrating hematopoietic stem and progenitor cells (HSPCs) differentiation from endothelial cells in the ventral floor of the dorsal aorta (DA). No, Notochord; DA, Dorsal aorta; PCV, Posterior Cardinal Vein. (b,c) Green-to-red photoconversion of the DA in a 24 hpf Tg(egfl7:gal4);Tg(UAS:Kaede);Tg(mrc1a:eGFP) triple-transgenic embryo, showing red/green (b) or red only (c) confocal fluorescence images immediately after photoconversion at 24 hpf (b,c; n = 5 animals photoconverted). (d-h) Confocal images of green (d–g) and red (d,e,f,h) fluorescence in the thymus (d), trunk vessels (e) and dorsal optic tectum FGPs (f–h) in 5 dpf Tg(egfl7:gal4);Tg(UAS:Kaede);Tg(mrc1a:eGFP) triple-transgenic animal subjected to DA photoconversion at 24 hpf. Arrows in panels g and h show Mrc1a:eGFP positive FGPs on the head (g) that are not red fluorescent (h; n = 5/5 photoconverted animals lacking red fluorescent FGPs. Yellow box in notes region shown at higher magnification in panels g and h. (i–l) Confocal imaging of Lyve1:dsRed (magenta; i,k) and Runx1:GFP (green; i–l) fluorescence in the lateral head (i,j) or dorsal head (k,l) of 5 dpf Tg(lyve1:dsRed);Tg(runx1:eGFP) double-transgenic animals (rostral to the left in all panels; n = 3 animals imaged). Large arrows in panels i and j note the Runx1:GFP-positive thymus. Small arrows in panels i-l note Lyve1:dsRed-positive but Runx1:GFP-negative FGPs. (m,n) Confocal imaging of Lyve1:dsRed (magenta) and c-Myb:eGFP (green) fluorescence in the dorsal head of a 5 dpf Tg(lyve1:dsRed);Tg(c-myb:eGFP) double-transgenic animals (rostral to the left in all panels; n = 3 animals imaged). Boxed region in panel m is displayed at higher magnification in panel n. Large arrows note Lyve1:dsRed-positive but c-Myb:eGFP negative FGPs; small arrows note c-Myb:eGFP-positive but Lyve1:dsRed negative hematopoietic cells. Scale bars: 200 μm (b–c, g–k), 100 µm (d), 50 µm (e,f–h,i–n).