
|
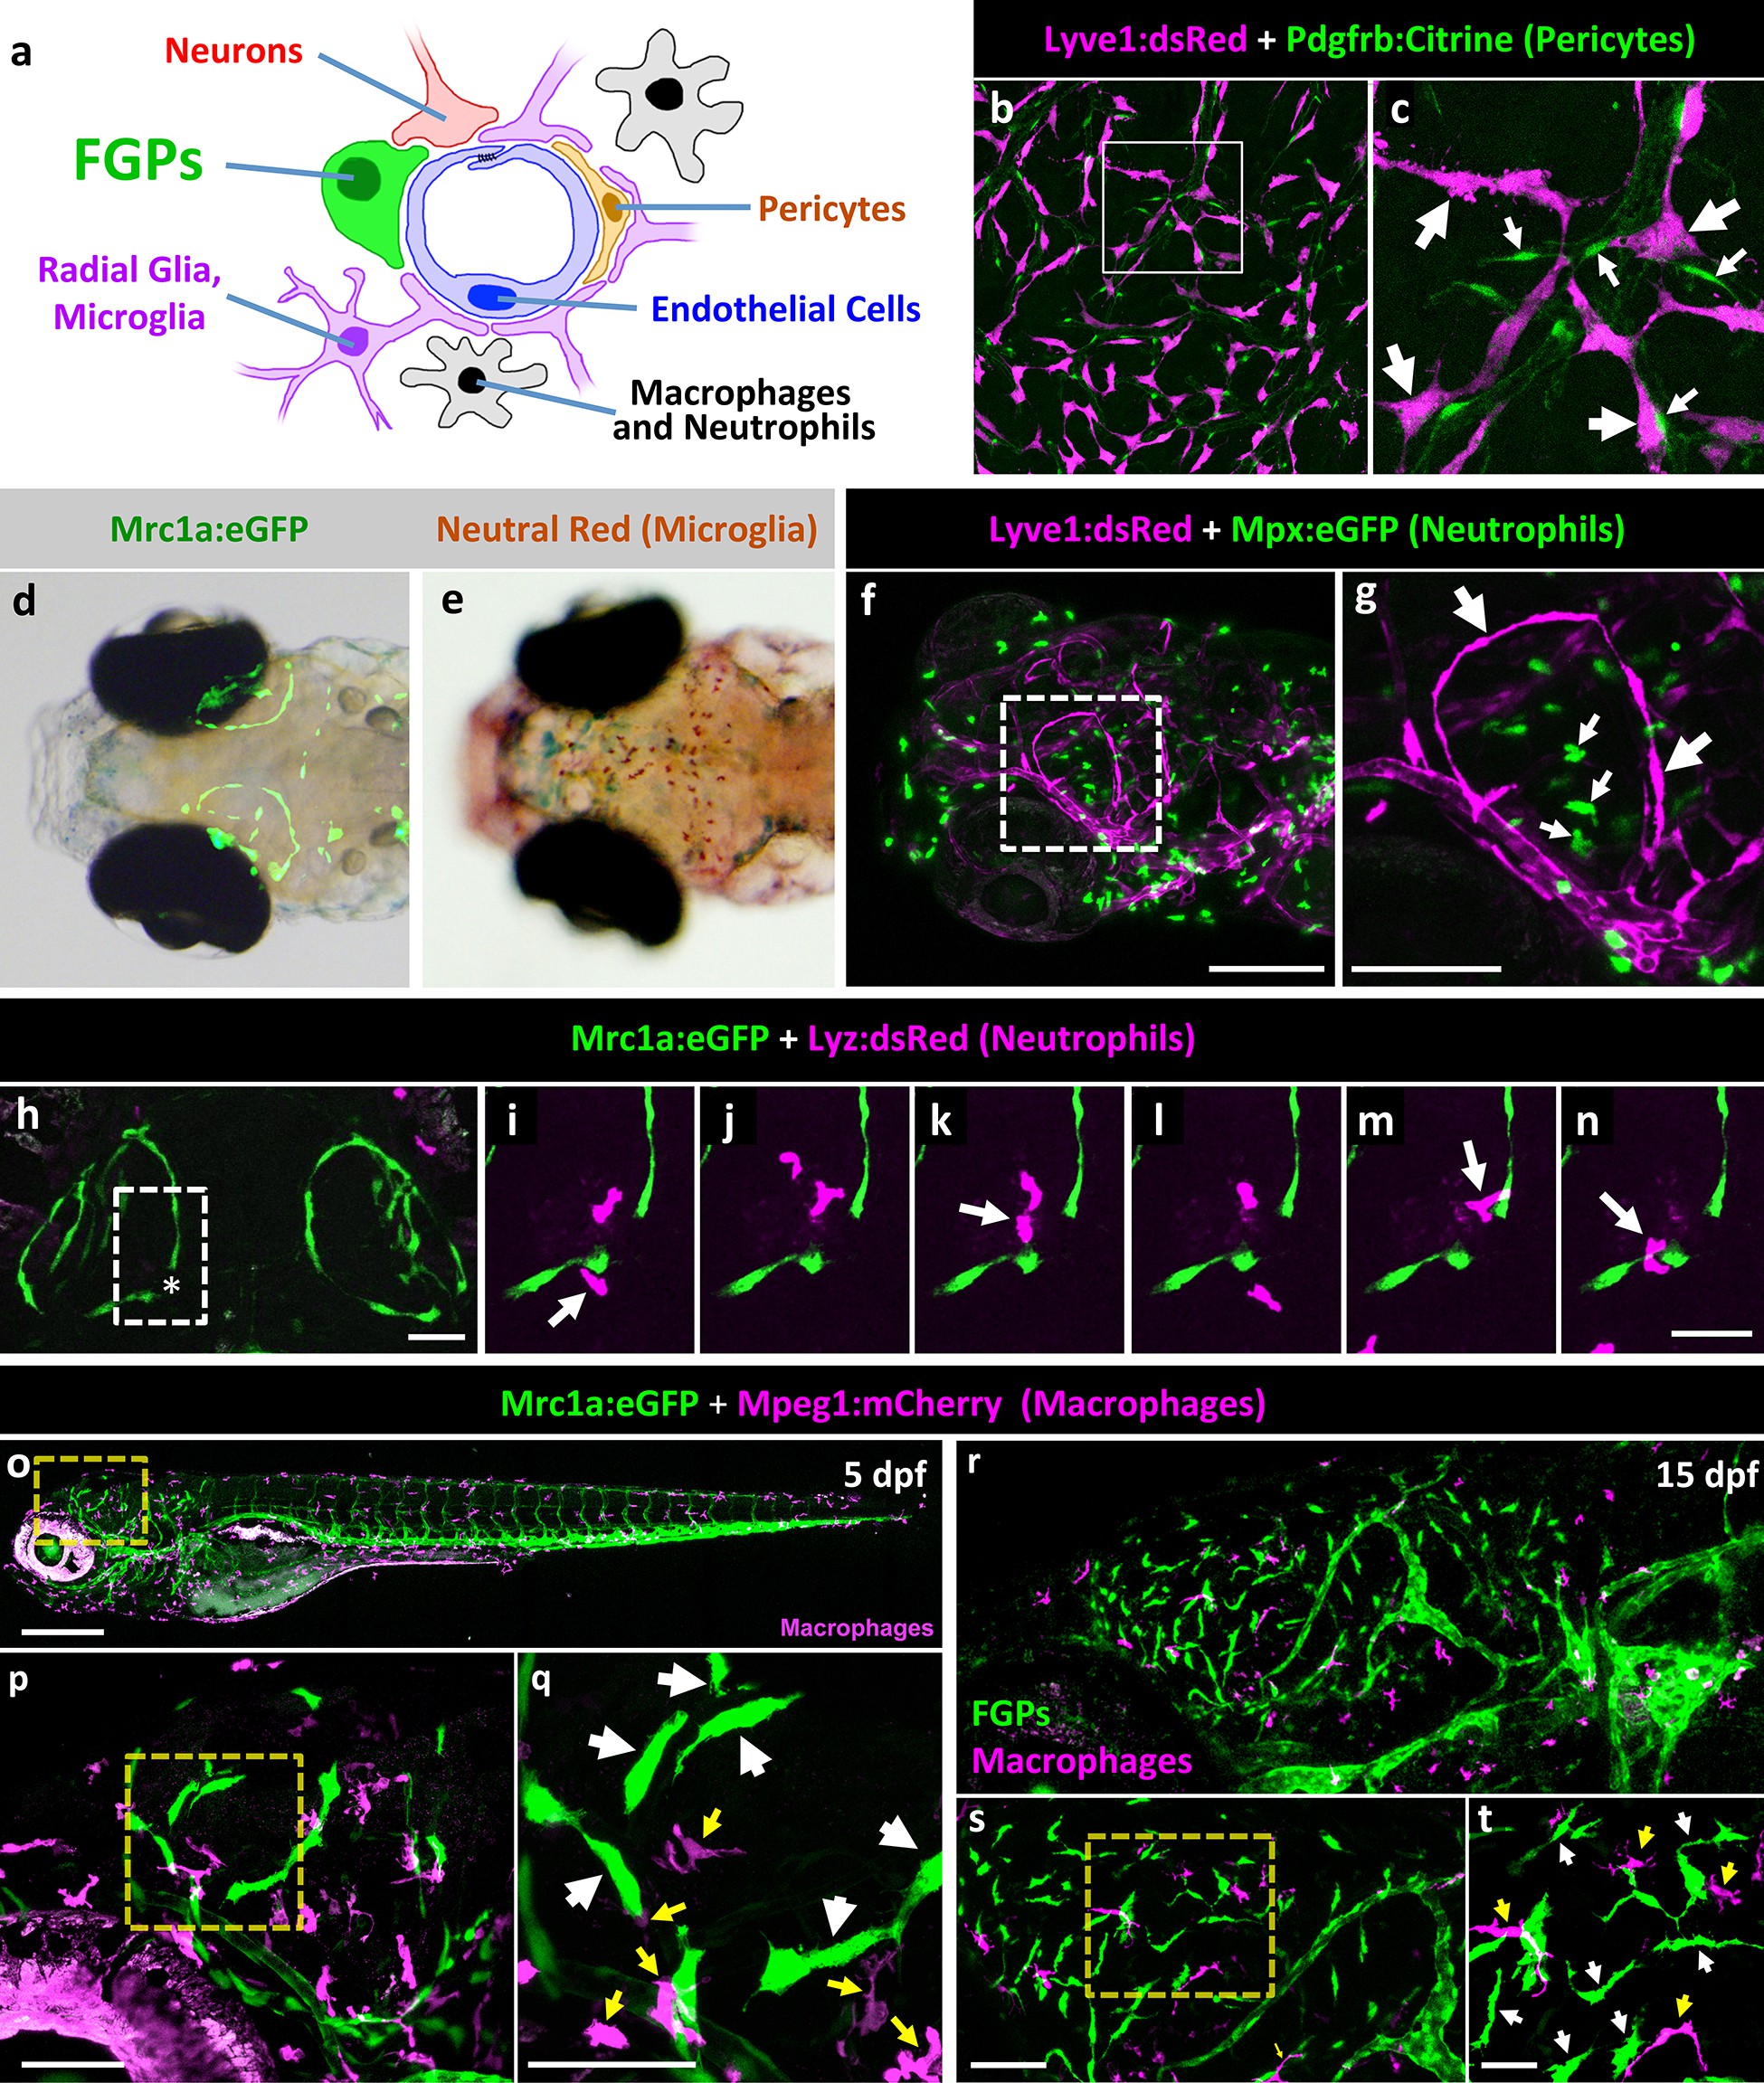
Fig. 4
Zebrafish FGPs do not correspond to other known perivascular cell types.
(a) Schematic diagram of cells associated with brain blood vessels, including the vascular endothelial cells, pericytes/smooth muscle cells, radial glia, macrophages/neutrophils, and FGPs. (b) Confocal image of Lyve1:dsRed-positive (magenta) and Pdgfrb:Citrine-positive (green) cells on the dissected brain of an adult Tg(lyve1:dsRed);Tg(pdgfrb:Citrine) double-transgenic zebrafish (n = 2 brains imaged). (c) Higher magnification confocal image of the same field illustrating that the two transgenes are expressed in distinct and separate cell populations - FGPs (large arrows) and pericyte (small arrows). (d) Transmitted light and epifluorescence Mrc1a:eGFP composite image of the dorsal head of a 5 dpf Tg(mrc1a:eGFP) transgenic animal (n = 15 animals). (e) Transmitted light image of the dorsal head of a neutral red-stained 5 dpf Tg(mrc1a:eGFP) transgenic animal (n = 15 animals). Rostral to the left. (f) Confocal image of Lyve1:dsRed-positive (magenta) and Mpx:eGFP-positive (green) cells in the head of a 5 dpf Tg(lyve1:dsRed);Tg(mpx:eGFP) double-transgenic zebrafish (n = 3 animals imaged). Lateral view, rostral to the left. (g) Higher magnification image of the boxed region in panel f, illustrating that the two transgenes are expressed in distinct and separate cell populations - FGP (large arrows) and neutrophils (small arrows). (h–n) Overview image (h) and magnified images of boxed region in panel h at selected time points (i–n) from a time-lapse confocal image series of Lyz:dsRed positive neutrophils (magenta) migrating into and out of the area of a wounded vessel (asterisk in h) on the dorsal brain surface of a 4 dpf Tg(mrc1a:eGFP);Tg(lyz:dsRed) double-transgenic zebrafish (rostral up), (n = 2 animals time-lapse imaged). The migrating neutrophils frequently interact with the FGPs adjacent to the wound site (arrows in panels i,k,m,n). (o) Lateral view confocal image of a 5 dpf Tg(mrc1a:eGFP);Tg(mpeg1:gal4);Tg(UAS:NTR-mCherry) triple-transgenic zebrafish, with Mrc1a:eGFP-positive cells in green and Mpeg1:Gal4/UAS-NTR-mCherry-positive macrophages in magenta. (p), Higher magnification image of the boxed region in panel o (n = 5 animals imaged). (q) Higher magnification image of the boxed region in panel p, showing that the two transgenes are expressed in distinct and separate FGP (white arrows) and macrophage (yellow arrows) cell populations. (r), Lateral view confocal image of the brain (centered on the optic lobes) of a 15 dpf Tg(mrc1a:eGFP);Tg(mpeg1:gal4);Tg(UAS:NTR-mCherry) triple-transgenic zebrafish, with Mrc1a:eGFP-positive cells in green and Mpeg1:Gal4/UAS-NTR-mCherry-positive macrophages in magenta (n = 3 animals imaged). (s), Higher magnification image of the brain in panel r. Yellow box shows magnified image in panel t. (t) Higher magnification image of the boxed region in panel s, showing that the two transgenes are expressed in distinct and separate FGP (white arrows) and macrophage (yellow arrows) cell populations. Rostral is to the left in all images. Scale bars: 100 µm (b, s, t), 50 μm (c, h–n), 200 µm (f,g, o–q).