
|
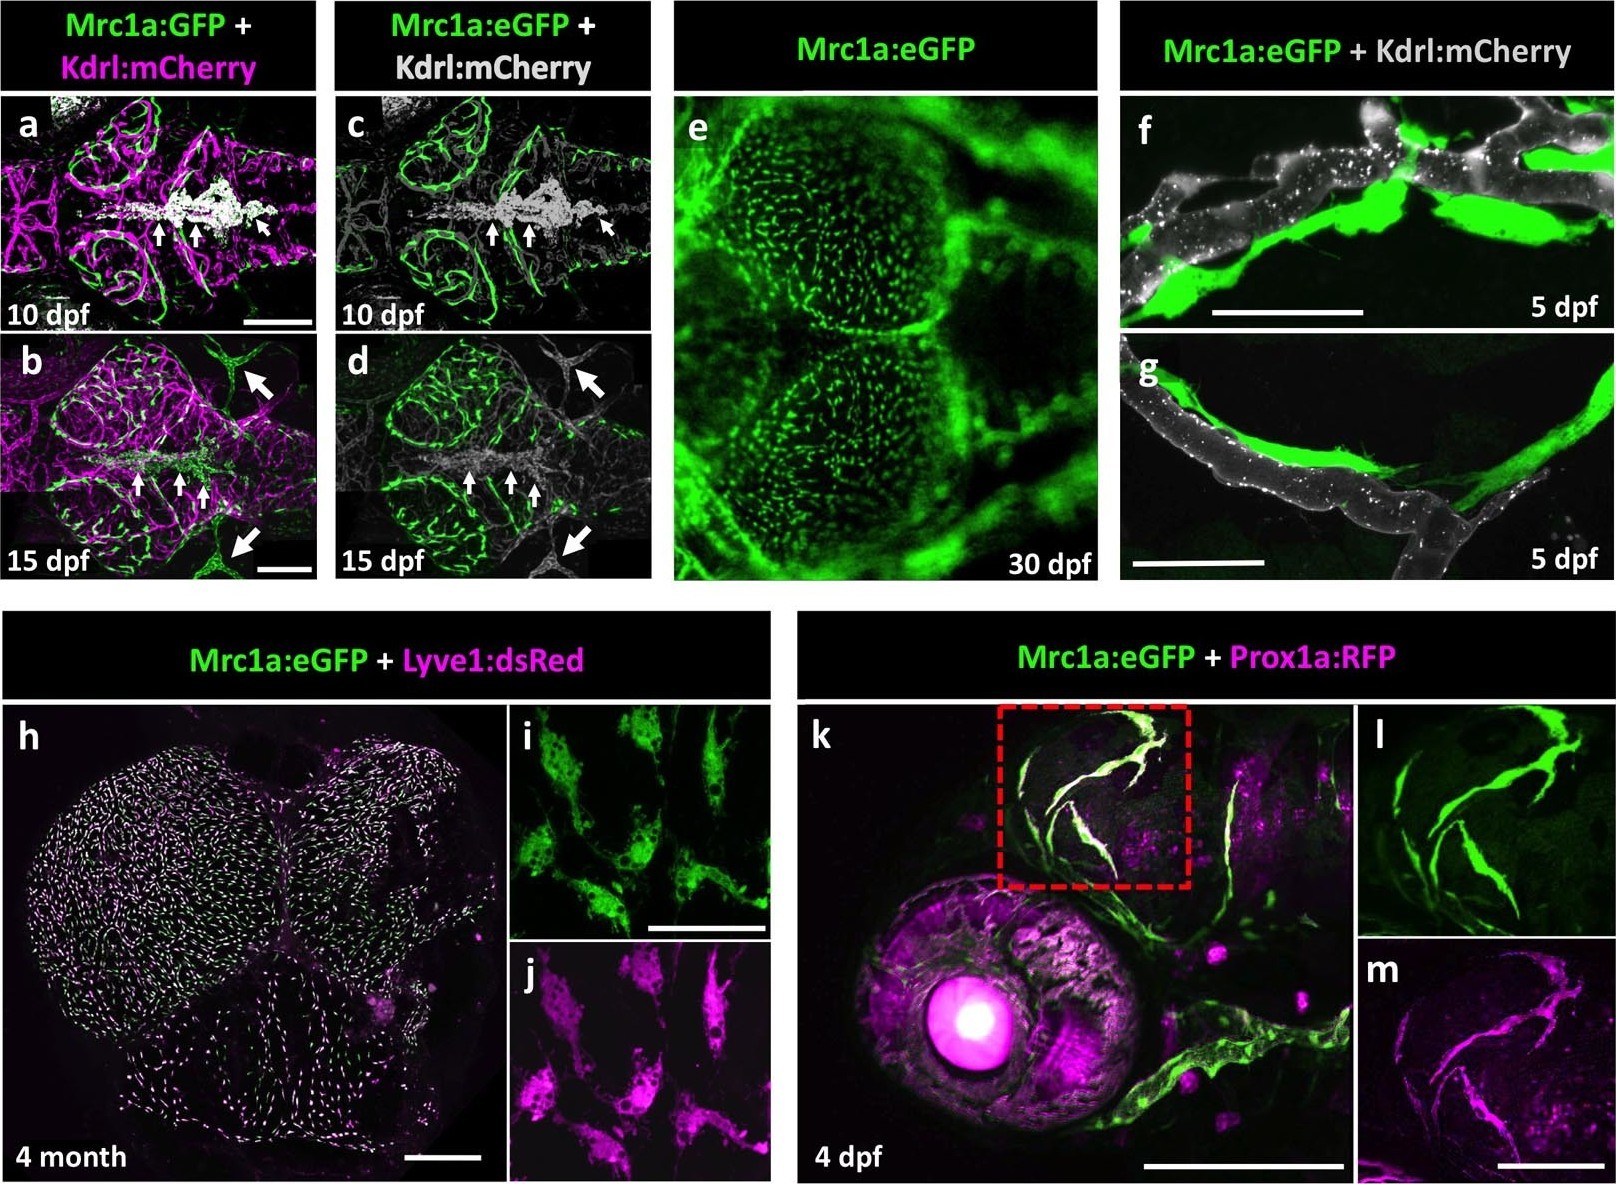
Fig. 2
Mrc1a-positive perivascular cells are present in the developing zebrafish brain, and express lymphatic markers.
(a,b) Confocal images of Mrc1a:eGFP-positive cells (green) and Kdrl:mCherry-positive blood vessels (magenta) on the surface of the brain in 10 dpf (a) and 15 dpf (b) Tg(mrc1a:eGFP);Tg(kdrl:mCherry) double-transgenic zebrafish (n = 3 animals of each age imaged). (c,d) Same images as in panels (a) and (b) with both Kdrl:mCherry blood vessel fluorescence and non-perivascular green fluorescence rendered in grey, Mrc1a-positive perivascular cells are depicted in green. Small arrows in panels a-d are autofluorescent pigment cells on the dorsal head of the zebrafish. Large arrows in panels b and d are facial lymphatics. (e) Epifluorescence microscopic image of Mrc1a:eGFP-positive cells on the optic lobes (left) of the dissected brain of a 1 month-old Tg(mrc1a:eGFP) transgenic zebrafish (n = 3 brains imaged). Panels a-e are dorsal views of the brain surface, with rostral to the left. (f,g) Airyscan confocal images of Mrc1a:eGFP-positive perivascular cells (green) extending along Kdrl:mCherry-positive blood vessels (grey) in 5 dpf Tg(mrc1a:eGFP);Tg(kdrl:mCherry-CAAX) double-transgenic zebrafish (n = 3 animals imaged). (h) Confocal image of Mrc1a:eGFP (green), Lyve1:dsRed (magenta) double-positive cells on the dissected brain of an adult 4 month old Tg(mrc1a:eGFP);Tg(lyve1:dsRed) double-transgenic zebrafish (dorsal view, rostral up), n = 3 brains imaged. (i,j) Higher magnification single-channel confocal images illustrating that the cells on the surface of the brain imaged in panel h are expressing both Mrc1a:eGFP (i) and Lyve1:dsRed (j). (k) Confocal image of Mrc1a:eGFP (green), Prox1a:RFP (magenta) double-positive cells on 4 dpf brain of a Tg(mrc1a:eGFP);Tg(prox1:RFP) double-transgenic animal (lateral view, rostral to the left). l,m, Single channel Mrc1a:eGFP (green; l) and Prox1a:RFP (magenta; m) images of the boxed region in panel k, showing the cells are expressing both transgenes. dpf, days post fertilization. Scale bars: 200 µm (a–d, k), 35 µm (f,g), 500 μm (h), 50 µm (i,j), 100 µm (l,m).