
Image
|
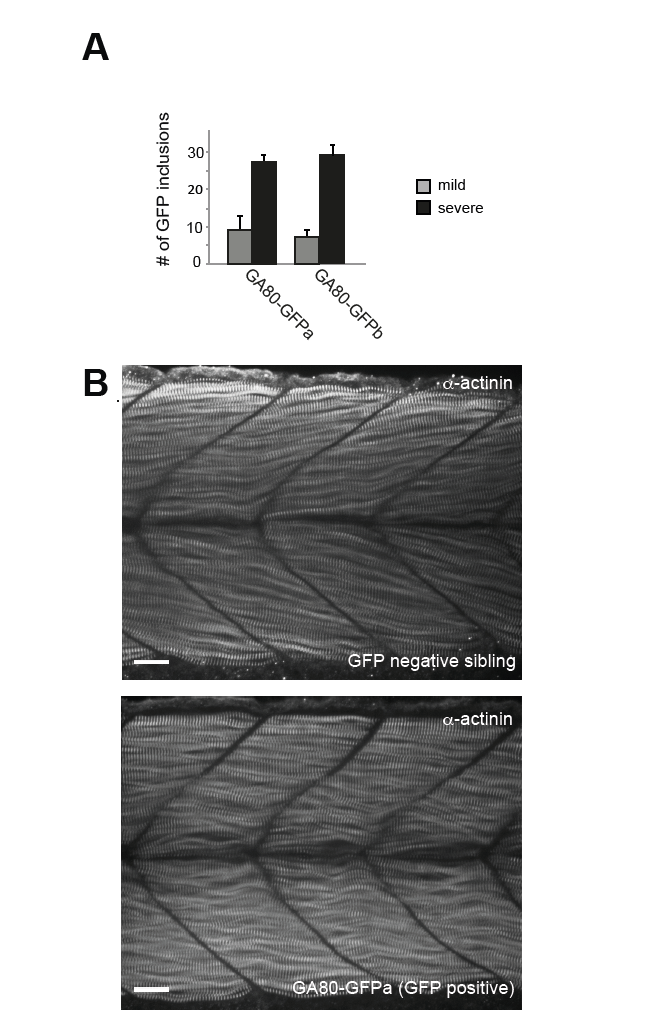
Figure Caption
Fig. S4
Muscle patterning is not affected. (A) Quantification of GFP inclusions in GA80-GFPa and GA80-GFPb larvae subdivided into mild and strong edema phenotypes at 4 dpf. (n = 4 per subgroup, mean ± SD). Amount of inclusions from GA80-GFP line a and b with mild and strong phenotypes were not significantly different (paired t-test). Inclusions were exclusively detected in the musculature in both lines. (B) The overall structure of the muscle was analyzed by α-actinin staining at 2 dpf in a GFP negative GA80-GFP embryo and (B) GFP positive sibling. Scale bar 20 μm.
Acknowledgments
This image is the copyrighted work of the attributed author or publisher, and
ZFIN has permission only to display this image to its users.
Additional permissions should be obtained from the applicable author or publisher of the image.
Full text @ Mol. Neurodegener.