
Image
|
Figure Caption
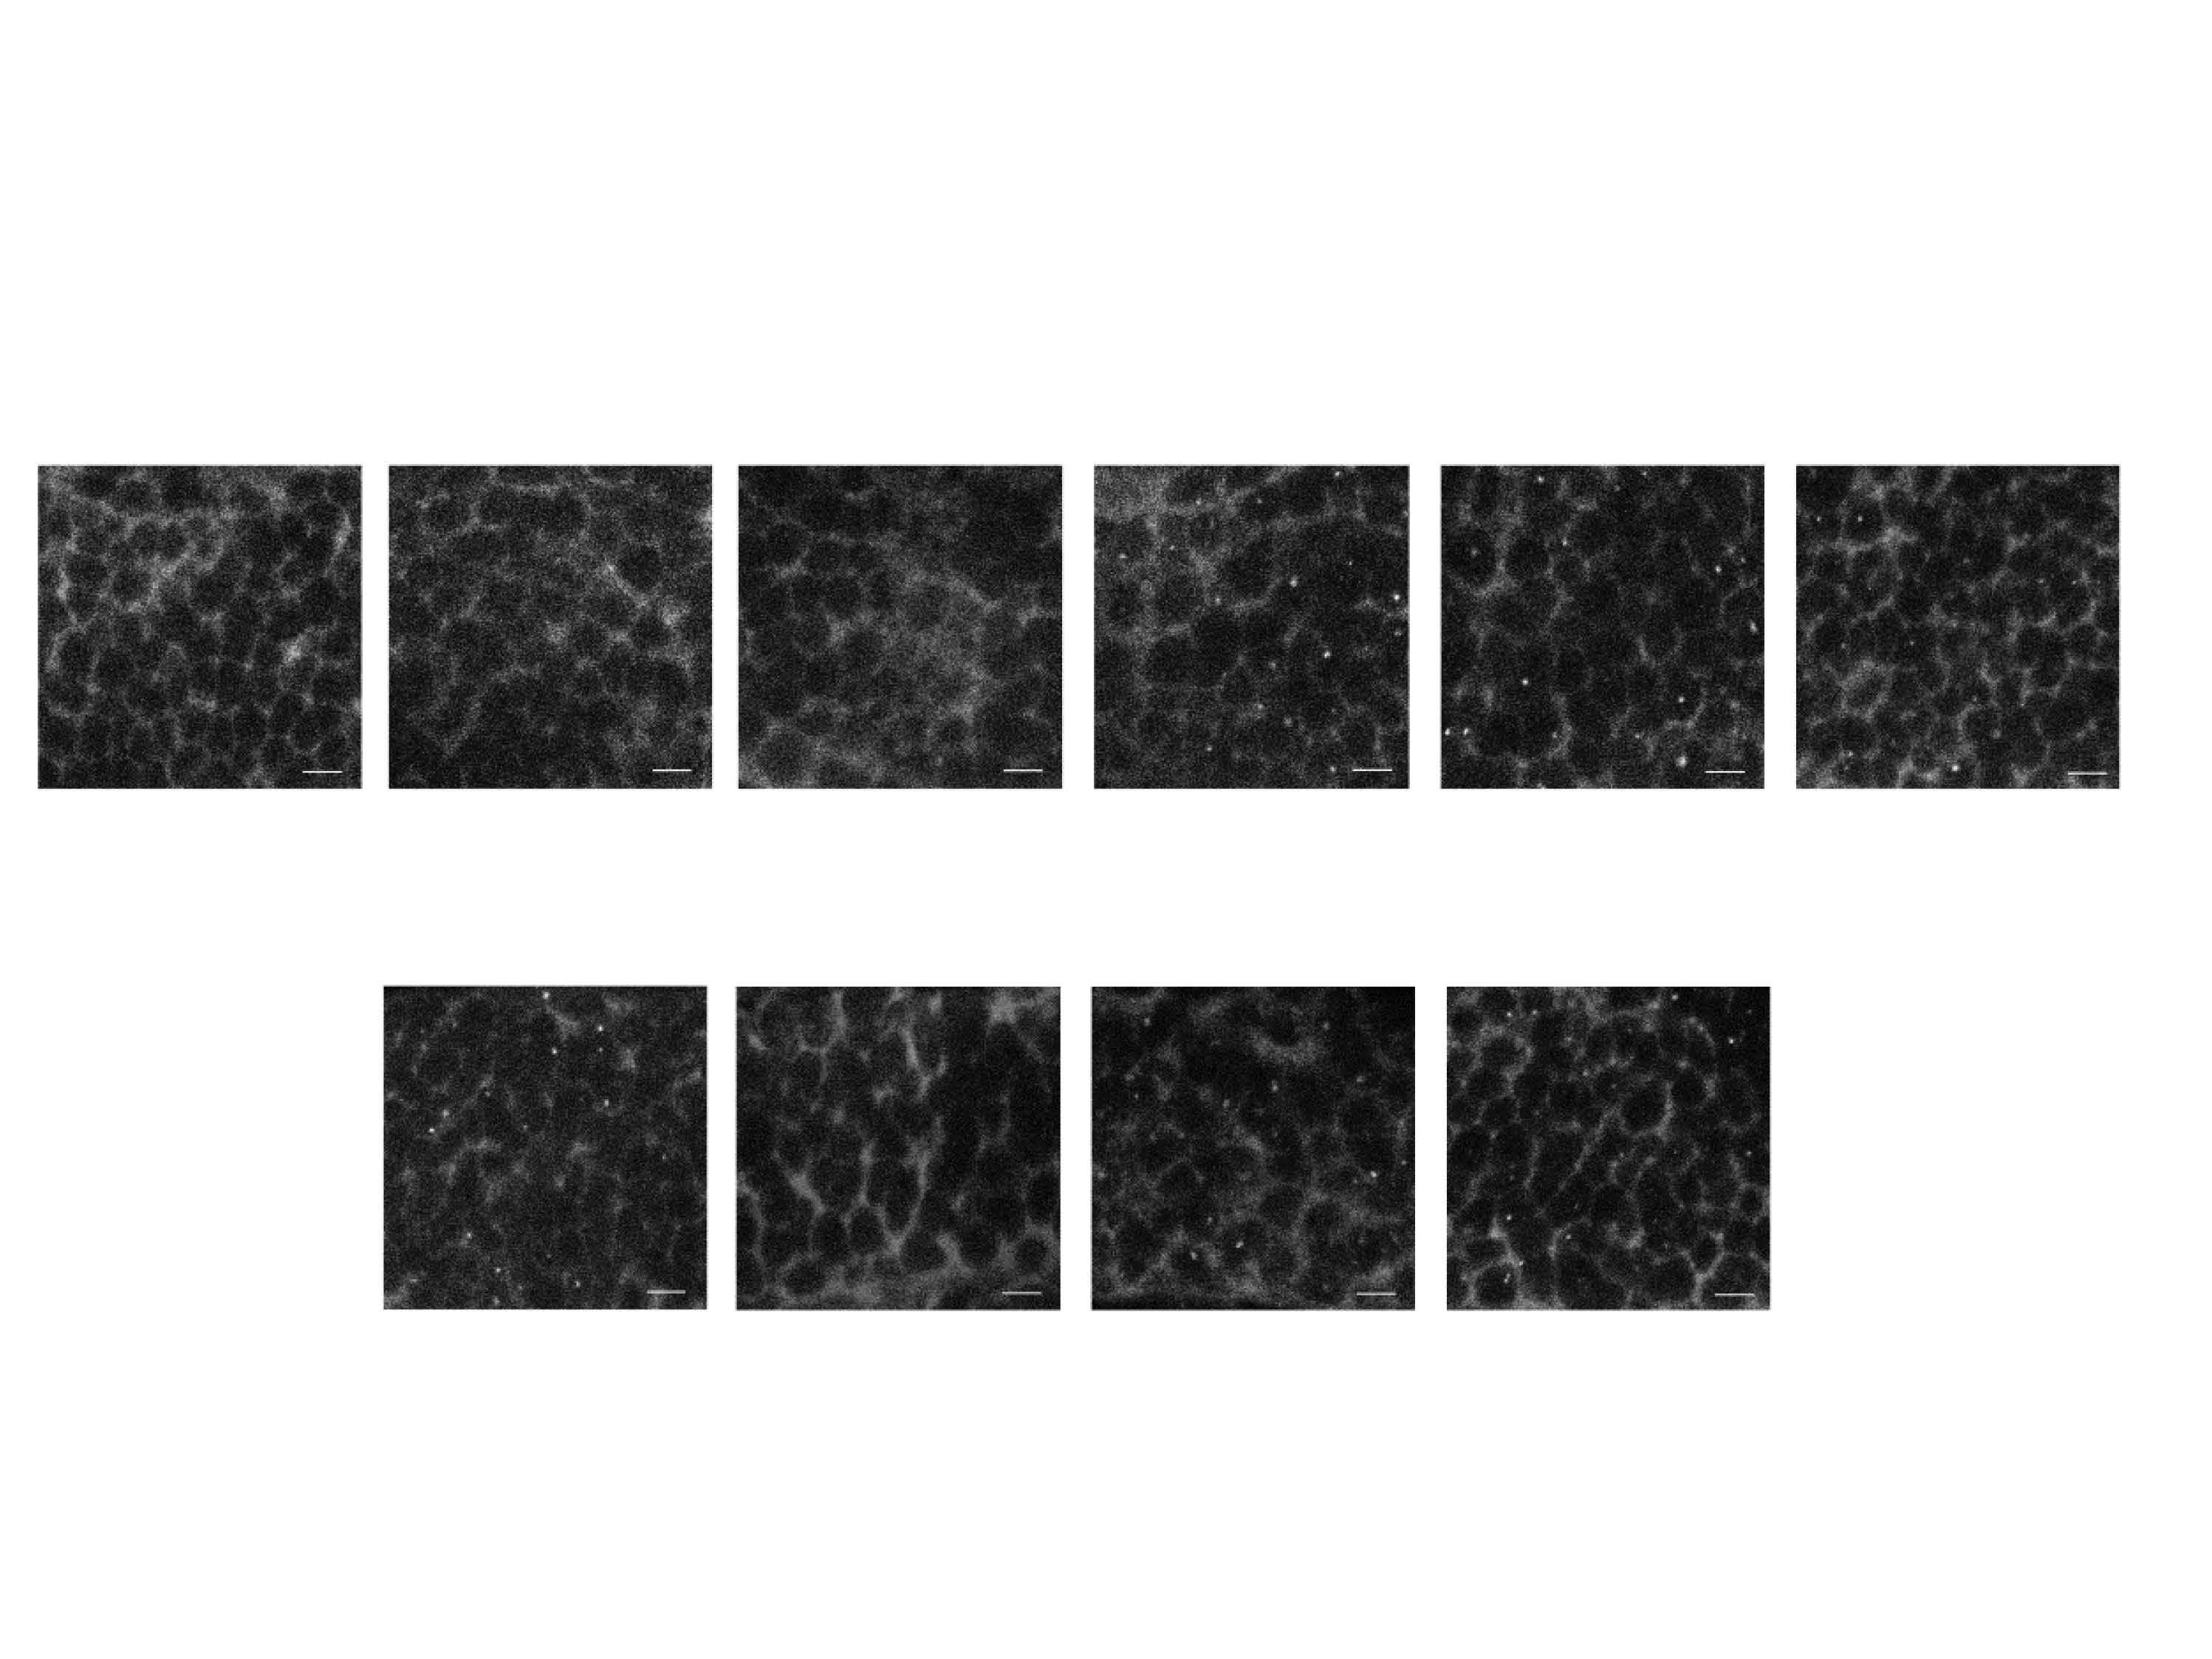
Fig. S1
RNA foci formation overview. Embryos of the indicated genotypes stained with a Cy3-labeled probe to visualize RNA foci formation by in situ hybridization. Between 13–33 cells per field of view showed RNA foci in the GA80-GFP larvae. All images were taken without DAPI fluorescence. Scale bar 10 μm.
Acknowledgments
This image is the copyrighted work of the attributed author or publisher, and
ZFIN has permission only to display this image to its users.
Additional permissions should be obtained from the applicable author or publisher of the image.
Full text @ Mol. Neurodegener.