
|
Fig. 5
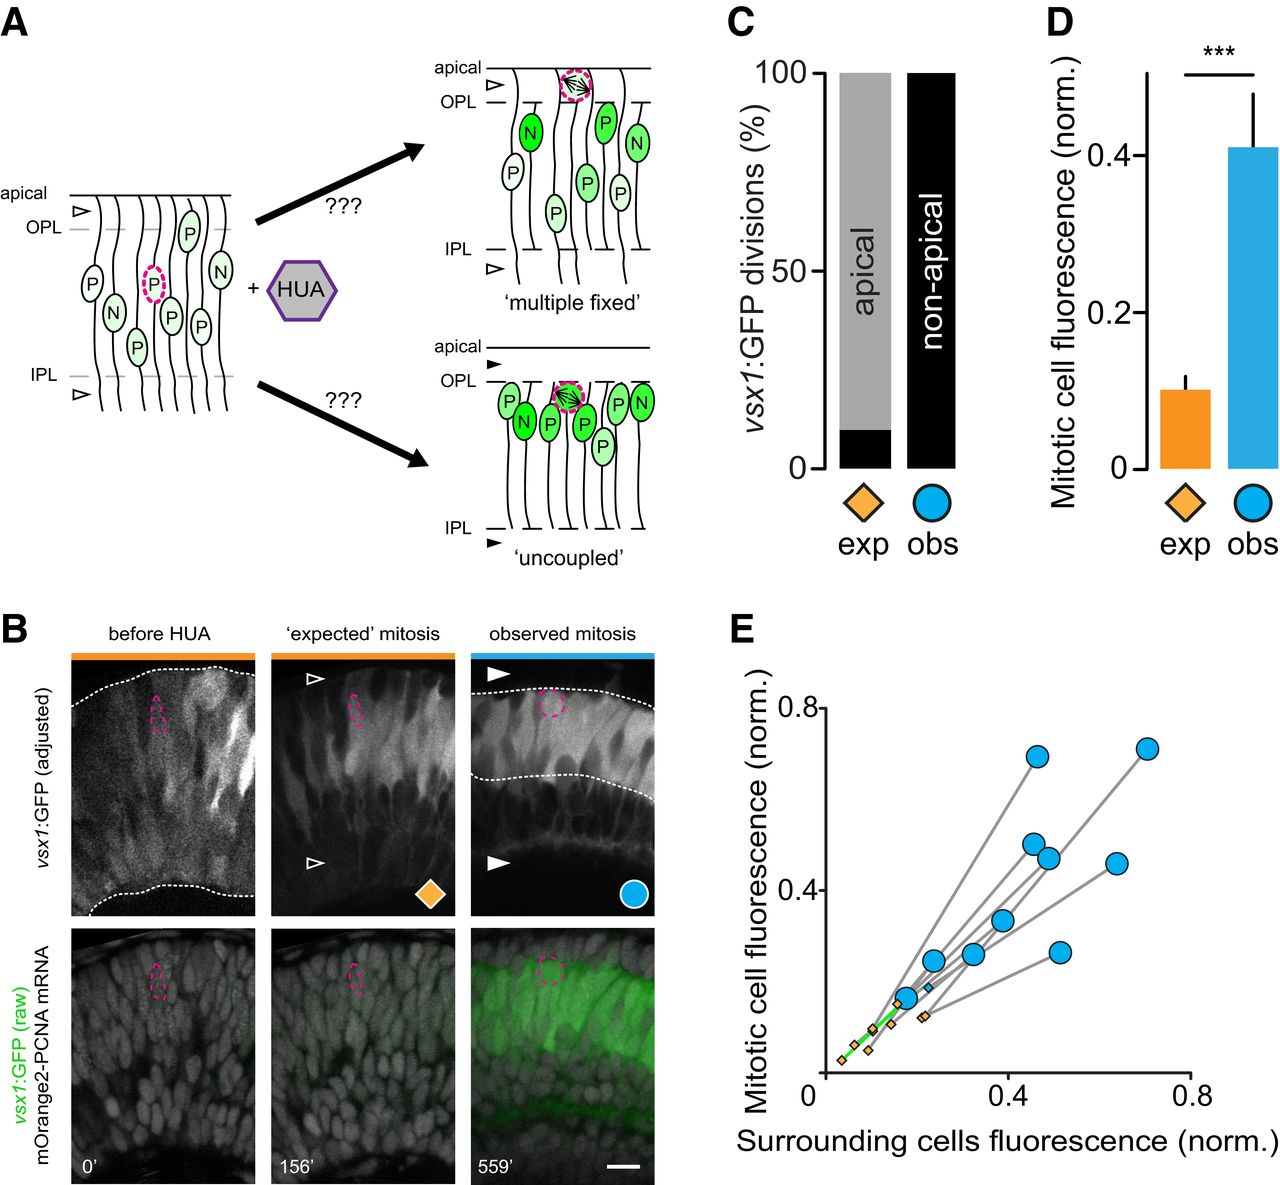
Neurogenesis and differentiation of vsx1+ progenitors are independent of each other
A. Schematic representation of expected outcomes if the immature retina (progenitors, P; neurons, N) is treated with HUA to delay the cell cycle. Upper panel: If there are multiple “fixed” progenitors, a block of cell division should stall progenitors at the differentiation state in which they normally would have undergone mitosis. The result would be a “salt‐and‐pepper” pattern of undifferentiated (light green) and differentiating progenitors (dark green). Lower panel: If cell cycle and differentiation are independent, all progenitors should homogenously differentiate. Open arrowheads indicate cytoplasmic processes not confined to the OPL and IPL, filled arrowheads indicate cytoplasmic processes confined to the synaptic layers.
B. Confocal images of a 2 dpf retina from a vsx1:GFP embryo injected with a p53 morpholino and mOrange2‐PCNA mRNA. A vsx1+ progenitor (dashed magenta outline) is shown before HUA treatment (left panel), at the time when it would have been “expected” to undergo mitosis (middle panel, orange diamond) and when it actually underwent mitosis (right panel, cyan circle). The retina and the vsx1+ progenitor continue to mature after the “expected” mitosis (retraction of cytoplasmic processes, mitosis at non‐apical location, and up‐regulation of GFP). Open arrowheads indicate cytoplasmic processes not confined to the OPL and IPL, filled arrowheads indicate cytoplasmic processes confined to the synaptic layers. Dotted lines indicate extent of vsx1+ cell somata across retinal thickness. Scale bar: 10 μm.
C. Progenitors that were expected to divide at the apical surface (exp), divided non‐apically (obs). 10 progenitors, four fish.
D. Quantification of vsx1:GFP fluorescence intensity of progenitors at the time when they were expected to undergo mitosis (exp, orange) and when they underwent mitotic division (obs, cyan). Data are presented as mean ± SEM, 10 progenitors, four fish. Mann–Whitney U‐test, ***P = 0.0002.
E. The fluorescence intensity of HUA‐treated vsx1:GFP progenitors at the time when they were expected to undergo mitosis (diamonds), and when they were observed to undergo mitosis (circles), plotted against the intensity of the surrounding cells (10 progenitors, four fish). One cell (cyan diamond) was expected to divide non‐apically. Green line indicates the fluorescence change of the lowest expressing progenitor for clarity.