
|
Fig. 2
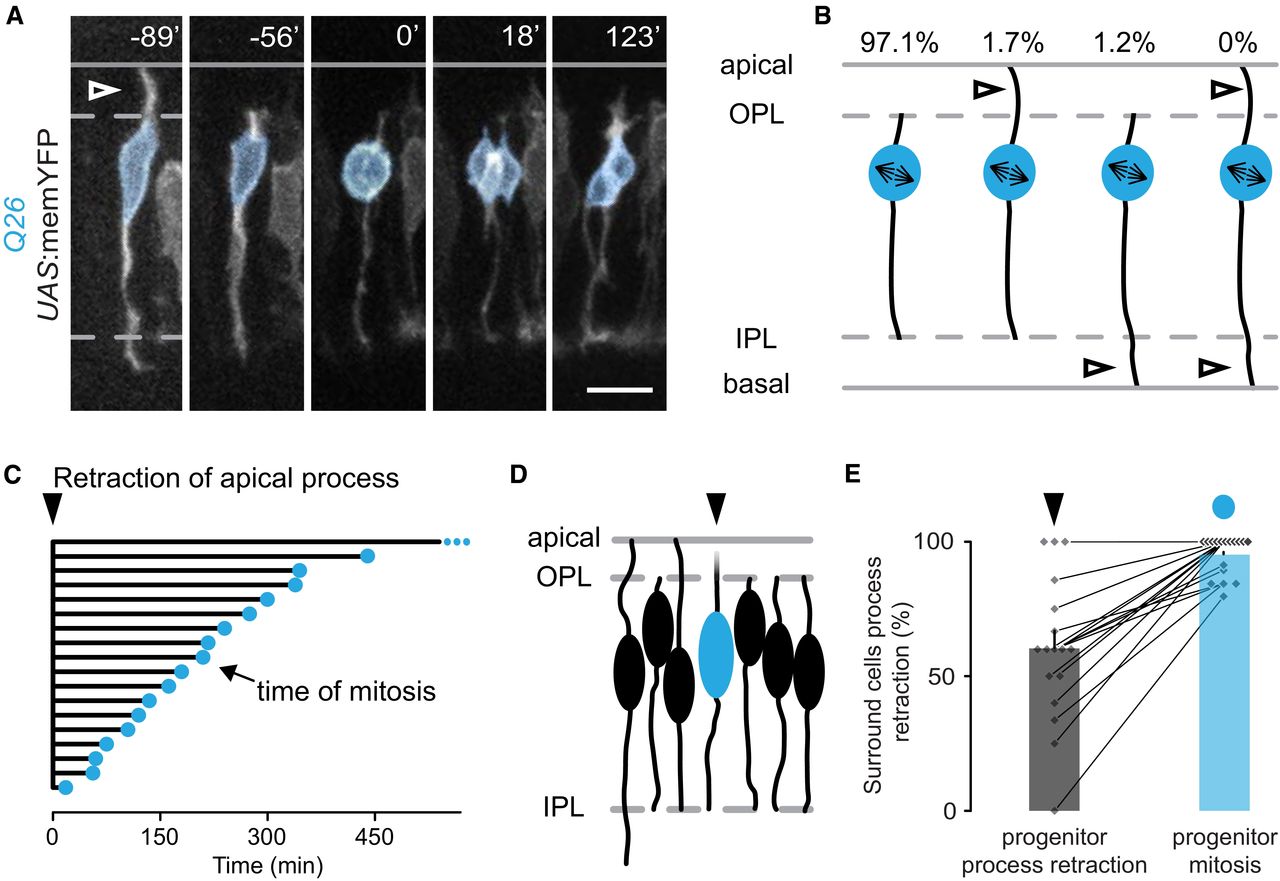
Morphological rearrangement of vsx1+ progenitors matches surrounding BCs
A. Confocal in vivo time‐lapse recording of a retina from the Q26 transgenic line (crossed to a UAS:memYFP reporter) showing a non‐apically dividing vsx1+ progenitor (pseudo‐colored cyan) with processes restricted to the IPL and OPL (dashed lines) during mitosis (0′). The last time point at which an apical process (open arrowhead) is detected is 89 min prior to mitosis. Scale bar: 10 μm.
B. Quantification of the distinct morphologies adopted by non‐apically dividing vsx1+ progenitors at M‐phase entry (122 progenitors, 17 fish). Open arrowheads indicate cytoplasmic processes extending beyond the synaptic layers (OPL and IPL, dashed lines).
C. Quantification of the time interval between retraction of the apical process (triangle) and mitosis (cyan circle) of non‐apically dividing vsx1+ progenitors shows a broad range from 18 min to more than 540 min. As only mitosis, but not process retraction was observed for the progenitor depicted with small cyan dots, the movie length of 540 min is an underestimate. 18 progenitors from 11 fish.
D. Schematic of apical process retraction (triangle) in a non‐apical vsx1+ progenitor (cyan soma) and the presence or absence of apical processes in the surrounding, post‐mitotic BCs.
E. Quantification of the percentage of surrounding post‐mitotic BCs without an apical process at the time when pre‐mitotic vsx1+ progenitors undergo apical process retraction (triangle, 60.3 ± 6.6%) and at the time when these progenitors undergo mitosis (cyan circle, 95.1 ± 1.7%). Data are presented as mean ± SEM, 17 progenitors, 10 fish.