
|
Fig. 3
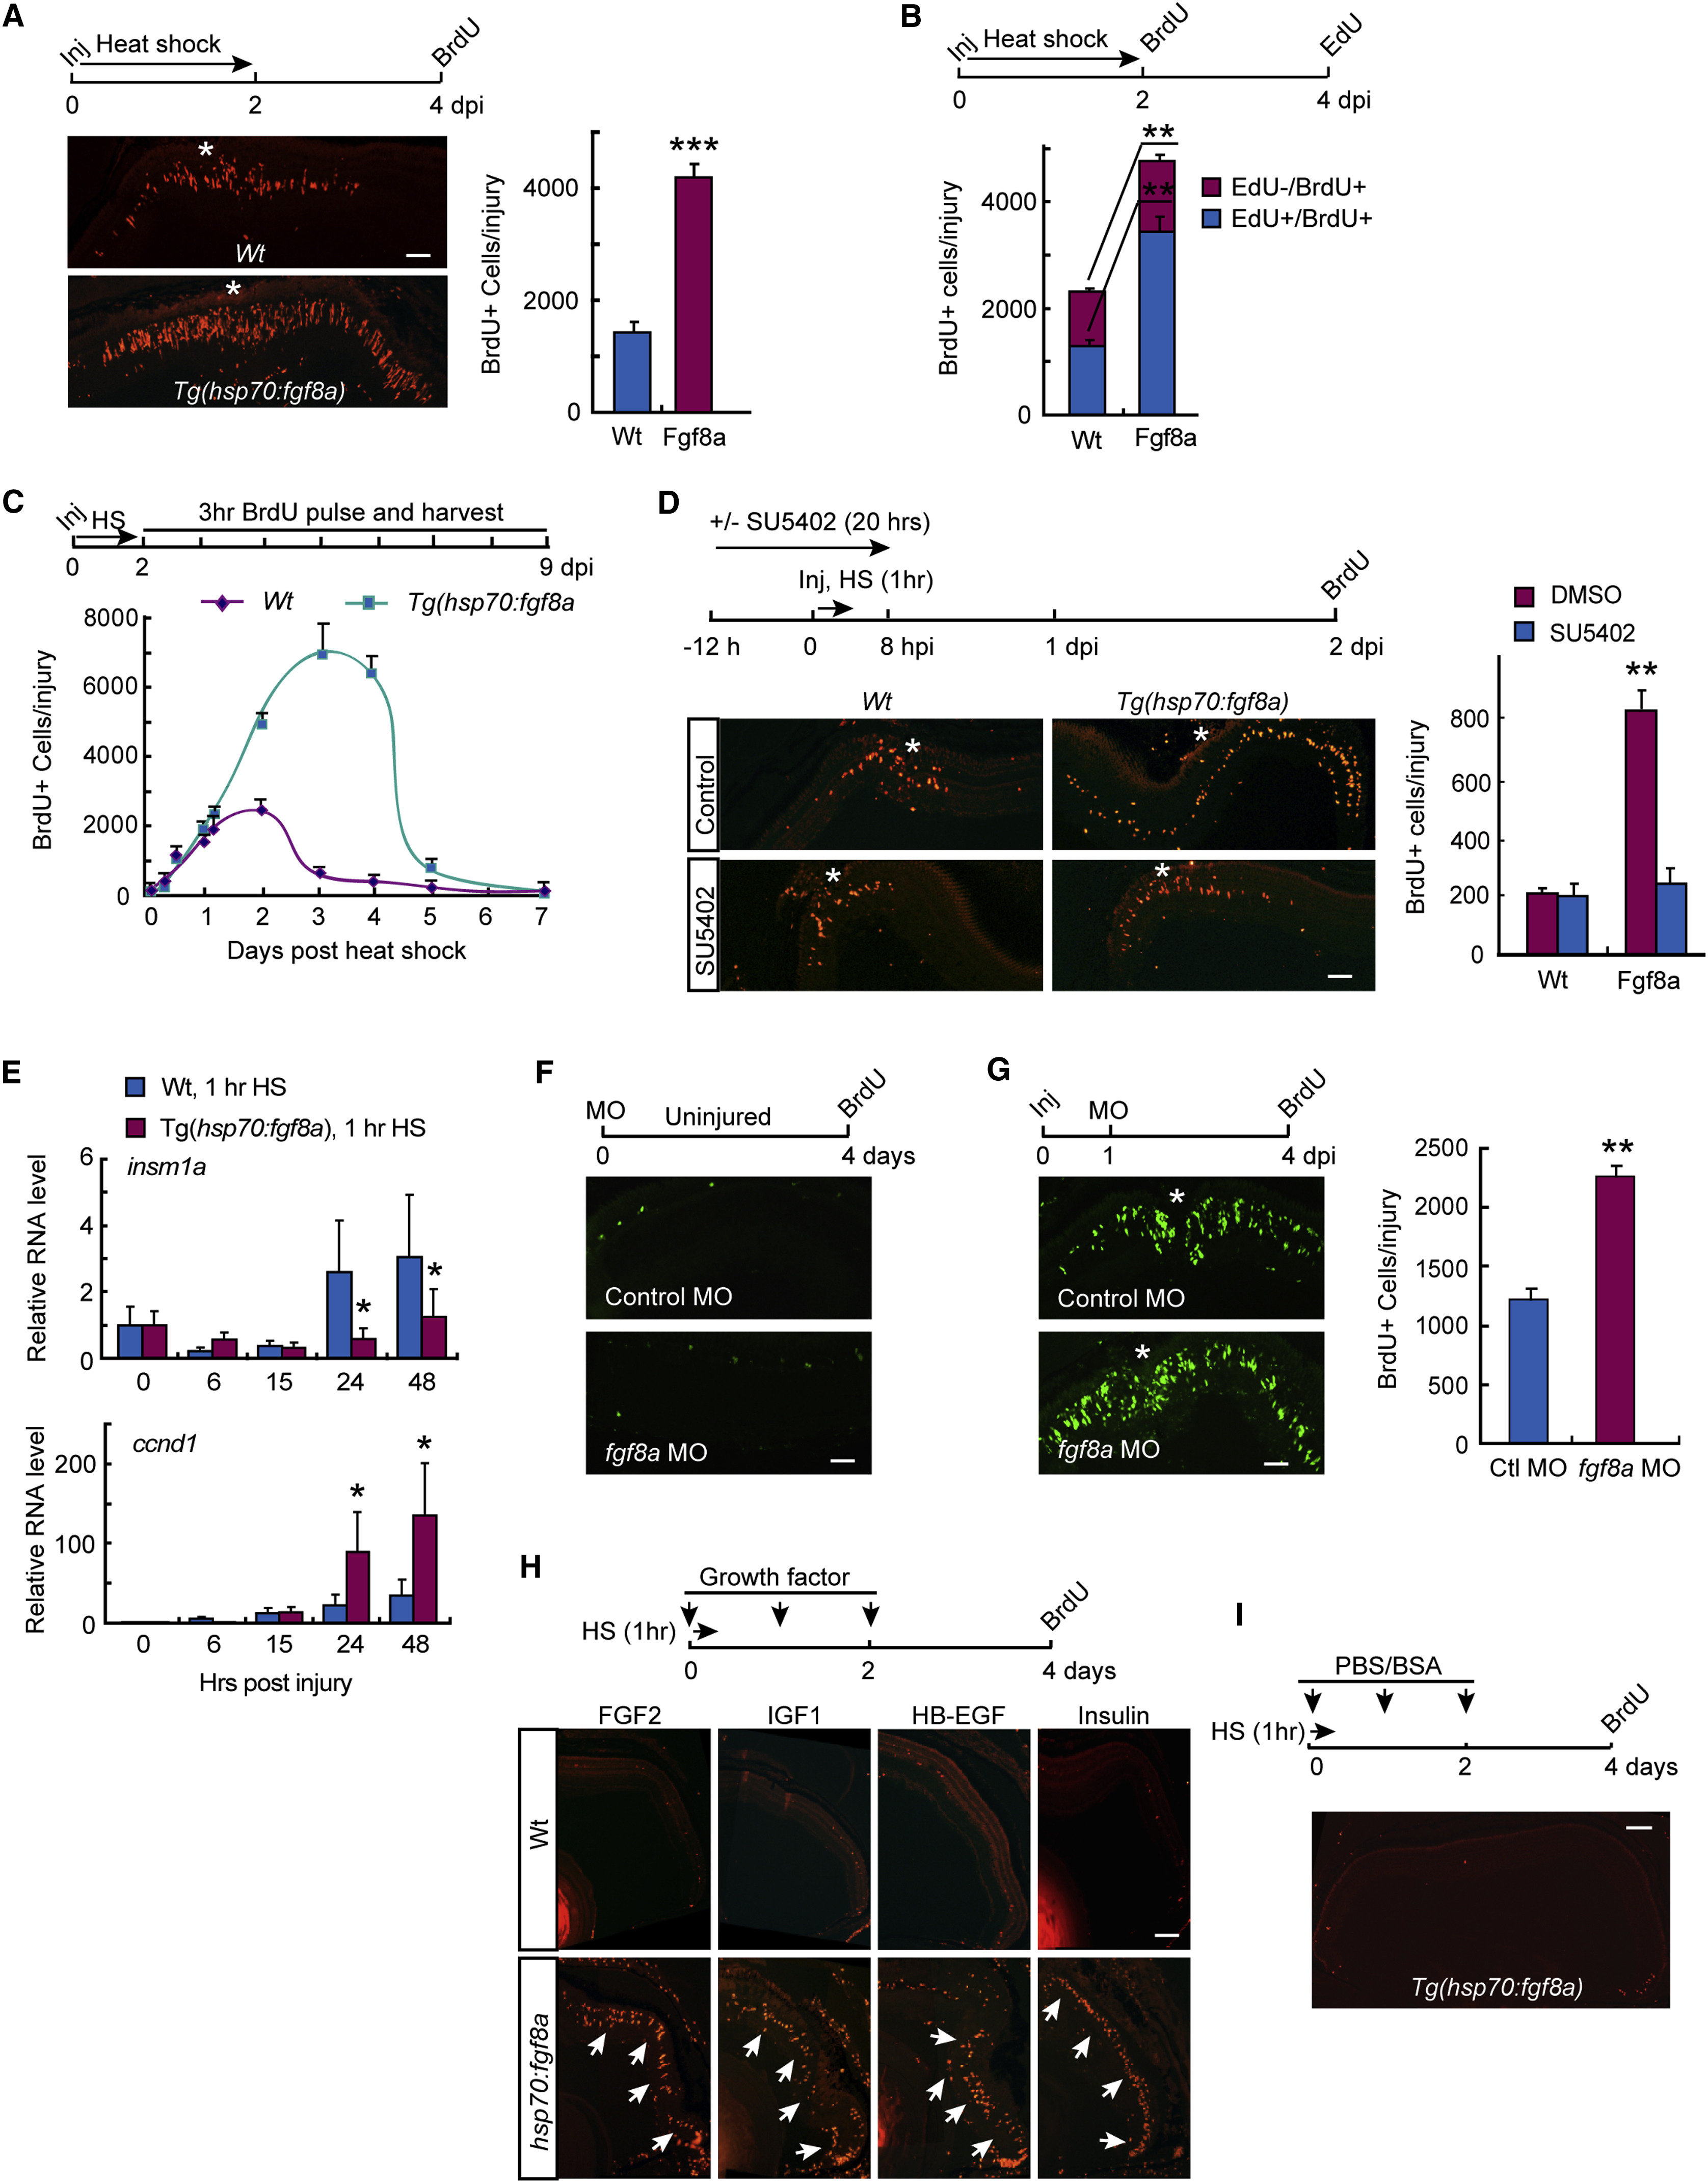
Cessation of Forced Fgf8a Expression Stimulates MG Proliferation in Injured or Growth-Factor-Treated Retina
(A) BrdU immunofluorescence in injured (Inj) retinas from WT and hsp70:fgf8a fish that received HS for 2 days and were assayed for MG proliferation 2 days later; Asterisk indicates injury site (central retina, 6-month-old fish). Scale bar, 100 μm. Graph shows quantification of BrdU+ cells; n = 3 individual experiments. Error bars indicate SD. ∗∗∗p < 0.001.
(B) Graph quantifying BrdU+ and EdU+/BrdU+ double-labeled cells in injured retinas from WT and hsp70:fgf8a (Fgf8a) fish that received HS for 2 days and then received an i.p. injection of BrdU and EdU at the indicated times; n = 3 individual experiments. Error bars indicate SD. ∗∗p < 0.01.
(C) Quantification of BrdU immunofluorescence in injured retinas of WT and hsp70:fgf8a fish that received HS for 2 days and were then sacrificed 3 hr after an i.p. injection of BrdU at the indicated times post-HS; n = 3 individual experiments. Error bars indicate SD.
(D) BrdU immunofluorescence in injured retinas at 2 dpi from WT and hsp70:fgf8a fish that received a 1-hr HS at the time of injury and were immersed in fish water with or without SU5402 for the indicated time. Asterisk indicates injury site (central retina, 6-month-old fish). Scale bar, 100 μm. Graph shows quantification of BrdU+ cells; n = 3 individual experiments. Error bars indicate SD. ∗∗p < 0.01.
(E) qPCR analysis of insm1a and ccnd1 gene expression at different times post-injury in WT and hsp70:fgf8a fish that received a 1-hr HS at the time of injury; n = 3 individual experiments. Error bars indicate SD. ∗p < 0.05.
(F and G) BrdU immunofluorescence in uninjured (F) and injured (G) retinas electroporated with control and fgf8a-targeting MO at the indicated times. Asterisk indicates injury site (central retina, 6-month-old fish). Scale bar, 100 μm. Graph in (G) is quantification of proliferating MGs in injured retina treated with control (Ctrl) and fgf8a-targeting MO; n = 3 individual experiments. Error bars indicated SD. ∗∗p < 0.01.
(H and I) BrdU immunofluorescence in uninjured retinas from WT and hsp70:fgf8a fish that received a 1-hr HS and intravitreal injection of indicated growth factor (HB-EGF, 50 ng/μL; FGF2, 200 ng/μL; insulin growth factor 1 [IGF1], 200 ng/μL; insulin, 500 ng/μL) (H) or PBS/BSA (I) at the indicated times. Scale bar, 150 μm.
See also Figure S3.