
|
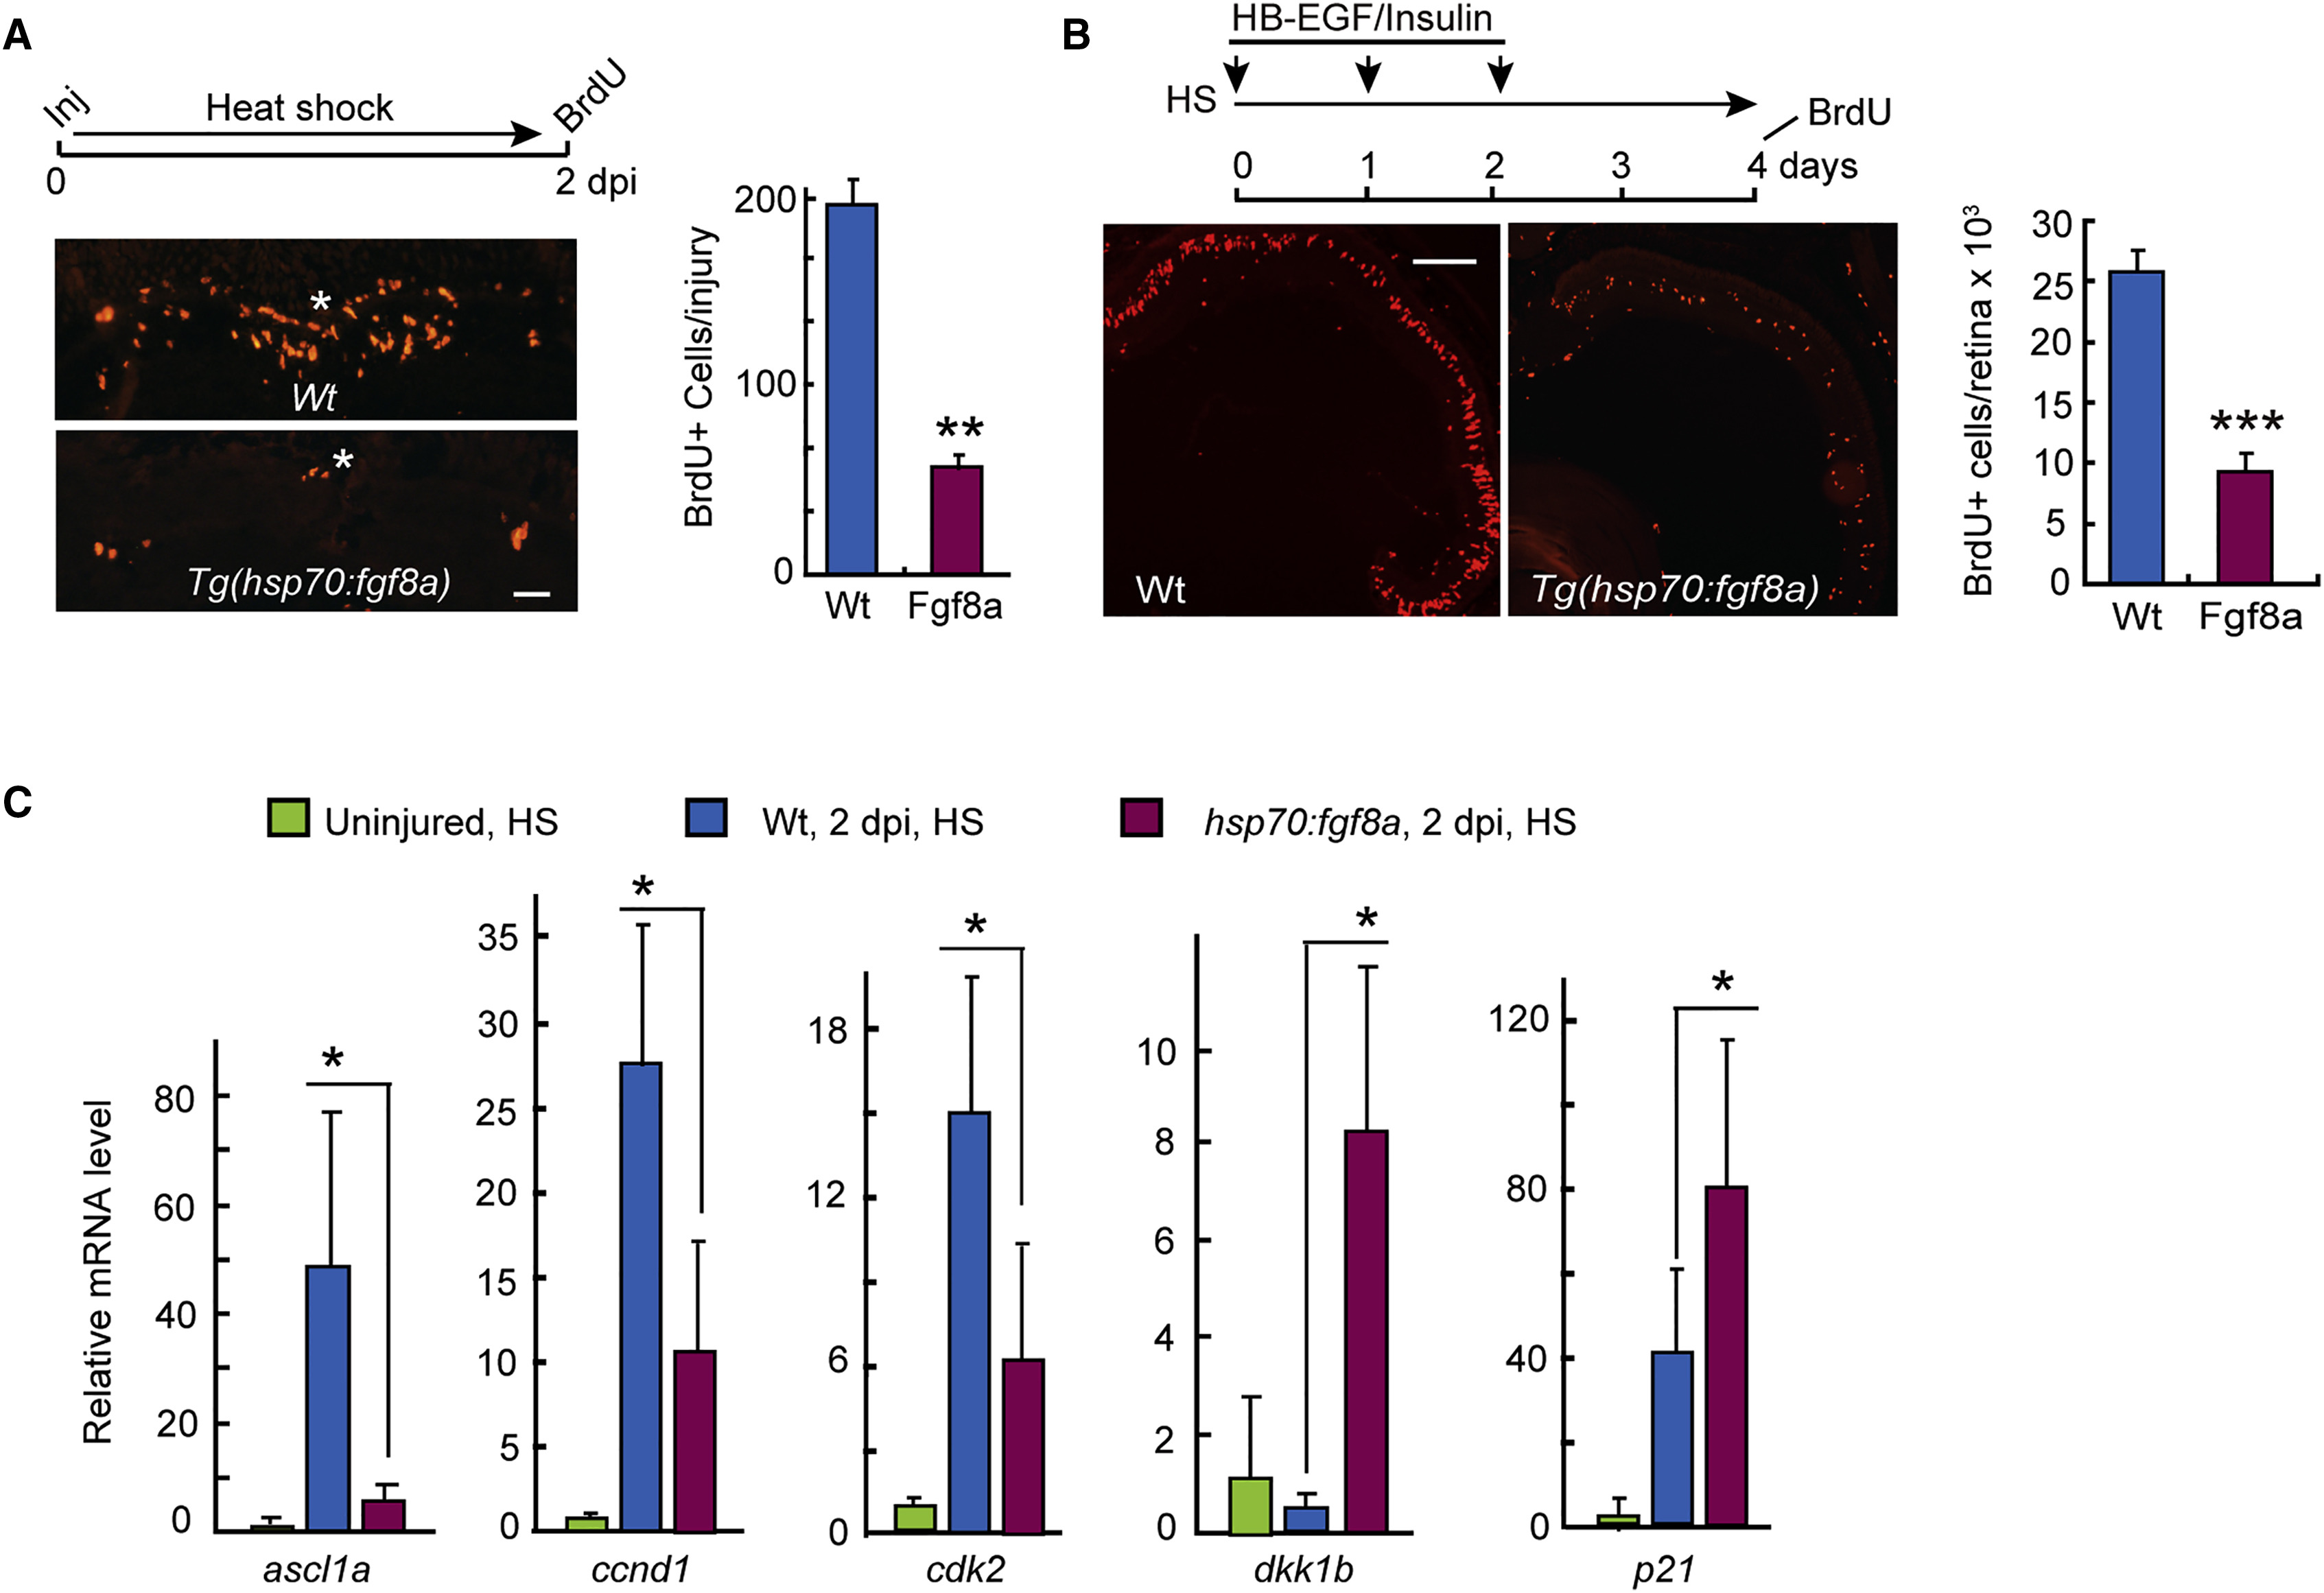
Fig. 2
Sustained Fgf8a Expression Inhibits MG Proliferation
(A) BrdU immunofluorescence was used to visualize and quantify MG proliferation in injured (Inj) retinas following 2 days of sustained HS in WT and hsp70:fgf8a fish. Asterisk indicates injury site (central retina of 6-month-old fish). Scale bar, 100 μm. Graph shows quantification of BrdU+ cells; n = 3 individual experiments. Error bars indicate SD. ∗∗p < 0.01.
(B) BrdU immunofluorescence was used to visualize and quantify MG proliferation in uninjured retinas following intravitreal injection of HB-EGF/insulin (once a day for 3 days) and HS (for 4 days) in WT and hsp70:fgf8a fish. Scale bar, 150 μm. Graph shows quantification of BrdU+ cells; n = 3 individual experiments. Error bars indicate SD. ∗∗∗p < 0.001.
(C) qPCR analysis of gene expression in uninjured and injured (2 dpi) WT and hsp70:fgf8a fish retinas with HS; n = 3 individual experiments. Error bars indicate SD. ∗p < 0.05.
See also Figure S2.