
|
Fig. S3
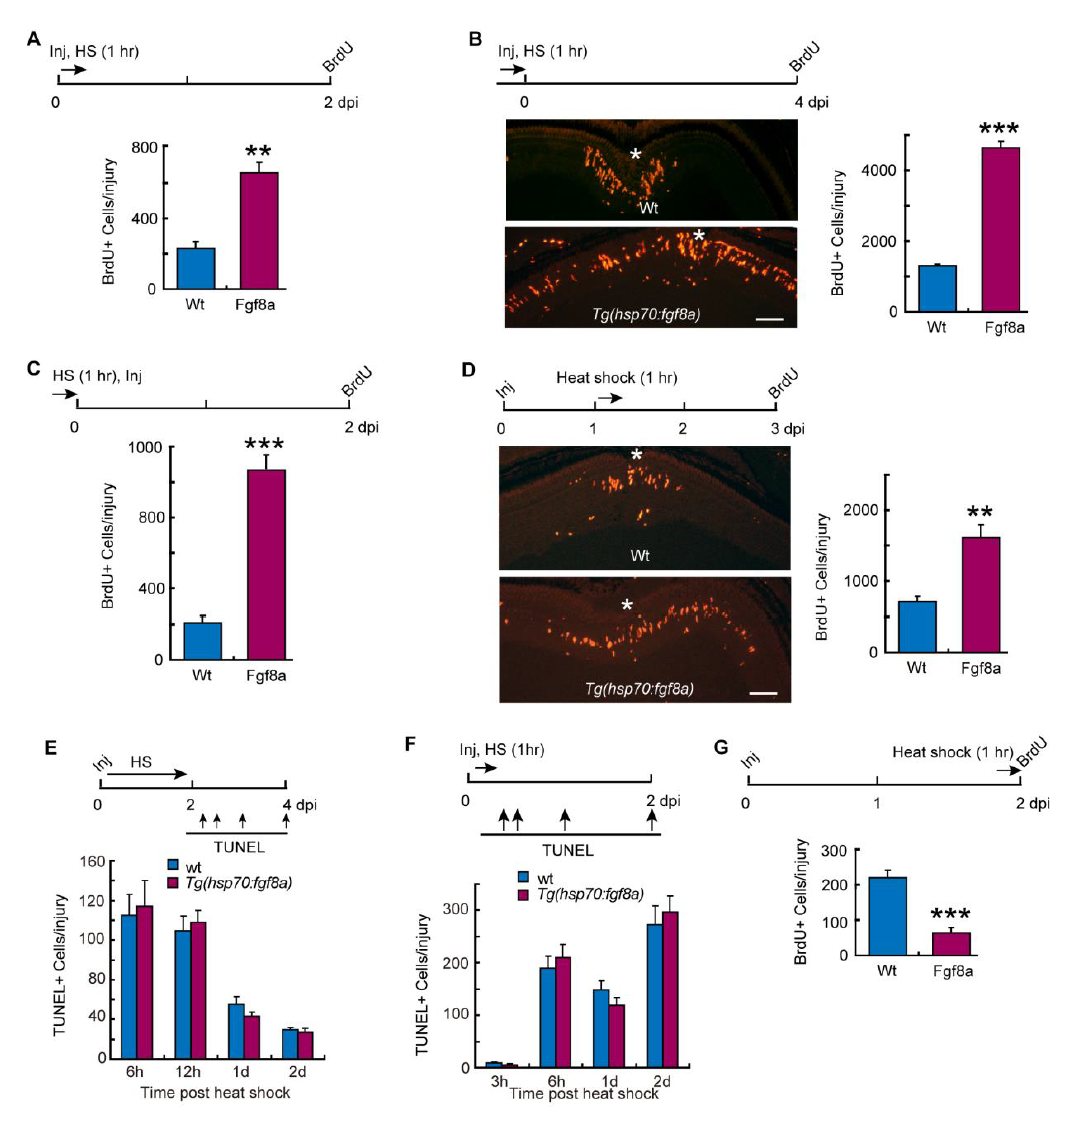
Related to Figure 3. Transient Fgf8a expression stimulates MG proliferation.
(A) Quantification of BrdU+ cells in injured retina from Wt and hsp70:fgf8a fish that received a 1 hr HS at the time of injury; n=3 individual experiments, error bars are s. d. **P<0.01.
(B) BrdU immunofluorescence in injured retinas from Wt and hsp70:fgf8a fish that received a 1 hr heat shock just before retinal injury. Asterisk indicates injury site (central retina, 6 mo old fish); scale bar is 100 µm. Graph shows quantification of BrdU+ cells/injury; n=3 individual experiments, error bars are s. d. ***P<0.001.
(C) As in (B) but BrdU incorporation quantified at 2 dpi; n=3 individual experiments, error bars are s. d. ***P<0.001.
(D) BrdU immunofluorescence in injured retinas from Wt and hsp70:fgf8a fish that received a 1 hr heat shock at 1 dpi. Asterisk indicates injury site (central retina, 6 mo old fish); scale bar is 100 µm. Graph shows quantification of BrdU+ cells/injury; n=3 individual experiments, error bars are s. d. **P<0.01.
(E, F) TUNEL assay was used to quantify cell death at various times in injured retinas from Wt and hsp70:fgf8a fish that received HS for 2 days (E) or for 1 hr (F); n=3 individual experiments, error bars are s. d.
(G) Quantification of BrdU+ cells at 2 dpi in Wt and hsp70:fgf8a fish that received a 1 hr HS 3 hrs before sacrifice; n=3 individual experiments, error bars are s. d. ***P<0.001.