
|
Fig. S6
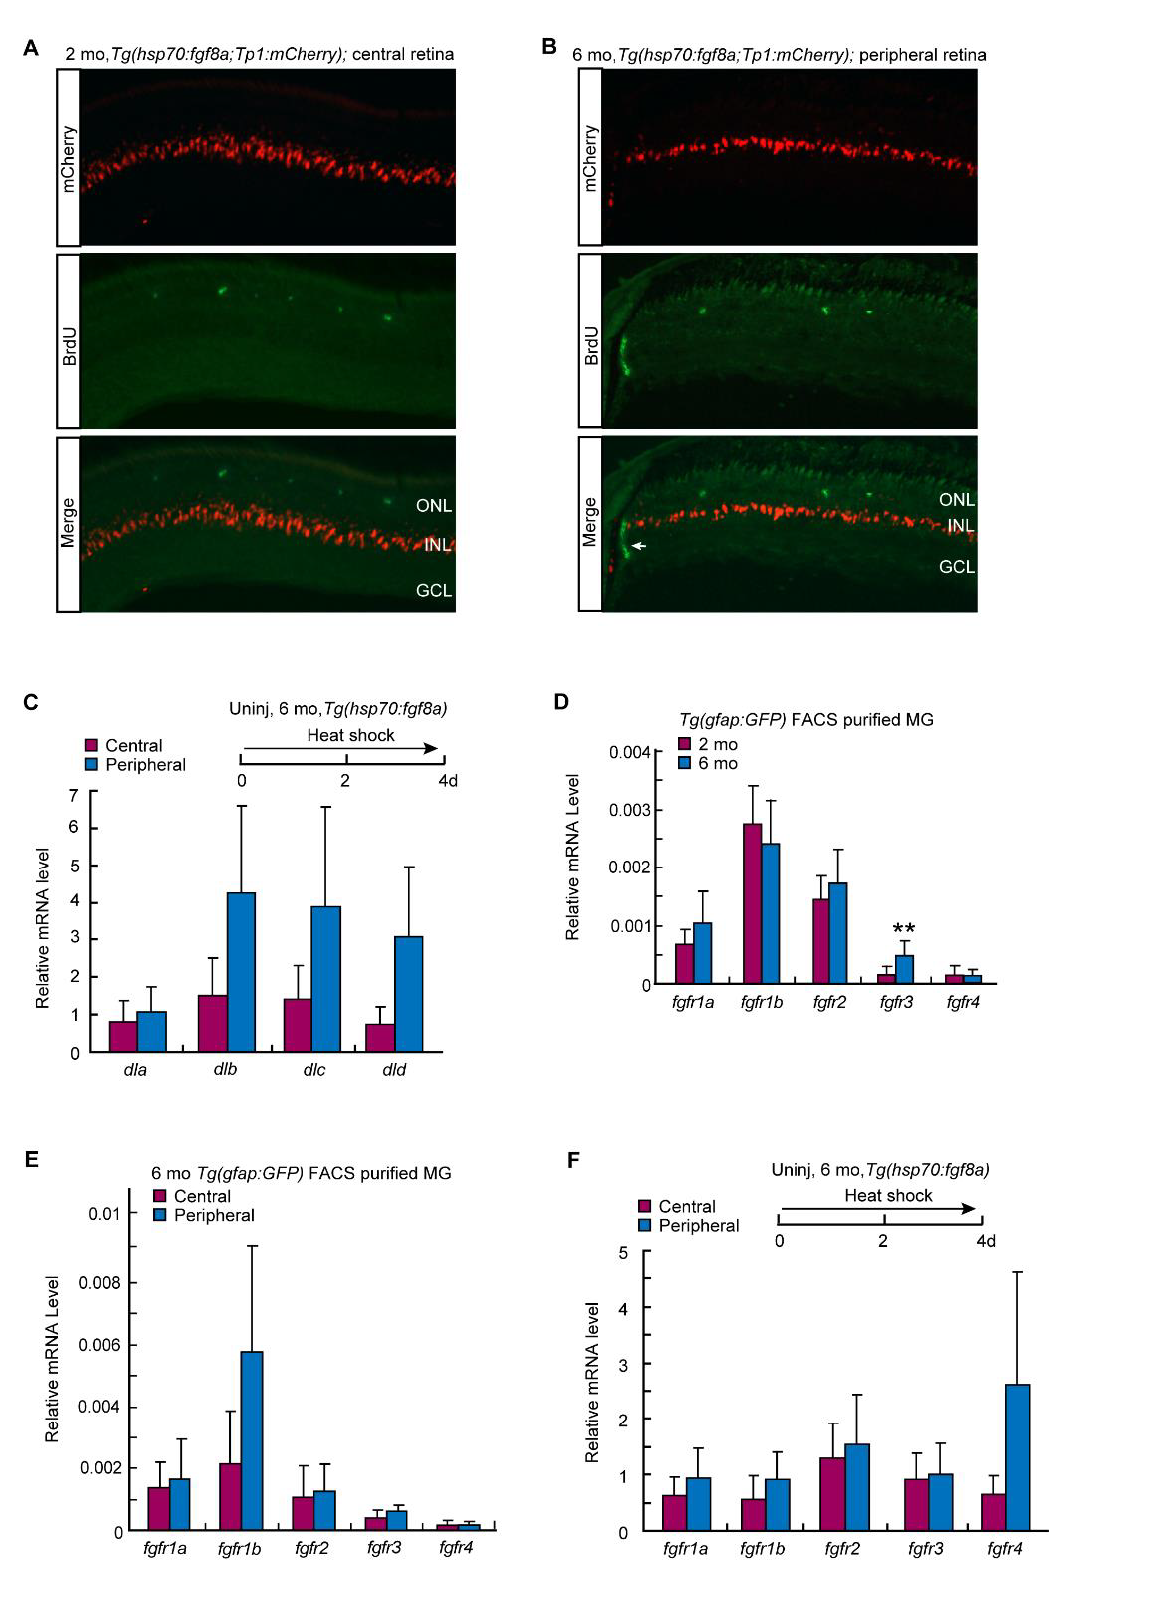
Related to Figure 6. Fgfr RNA levels.
(A, B) mCherry and BrdU immunofluorescence in 2 mo (A) and 6 mo (B) old hsp70:fgf8a;Tp1:mCherry transgenic fish retina. Arrow in (B) identifies proliferating retinal progenitors in the retinal ciliary marginal zone.
(C) qPCR analysis of delta-like (dl) gene expression in central and peripheral regions of uninjured retinas from 6 mo old hsp70:fgf8a fish that received HS for 4 days.; n=3 individual experiments, error bars are s. d.
(D) qPCR analysis of fgfr gene expression in MG that were FACS purified from uninjured gfap:GFP fish retinas at 2 and 6 mo of age; n=3 individual experiments, error bars are s. d. **P<0.01.
(E) qPCR analysis of fgfr gene expression in MG that were FACS purified from central and peripheral regions of uninjured gfap:GFP fish retinas at 2 and 6 mo of age; n=2 individual experiments, error bars are s. d.
(F) qPCR analysis of fgfr gene expression in central and peripheral regions of uninjured retinas from hsp70:fgf8a fish at 6 mo of age and that received HS for 4 days; n=3 individual experiments, error bars are s. d. Data was normalized to gapdh levels.