
|
Fig. 6
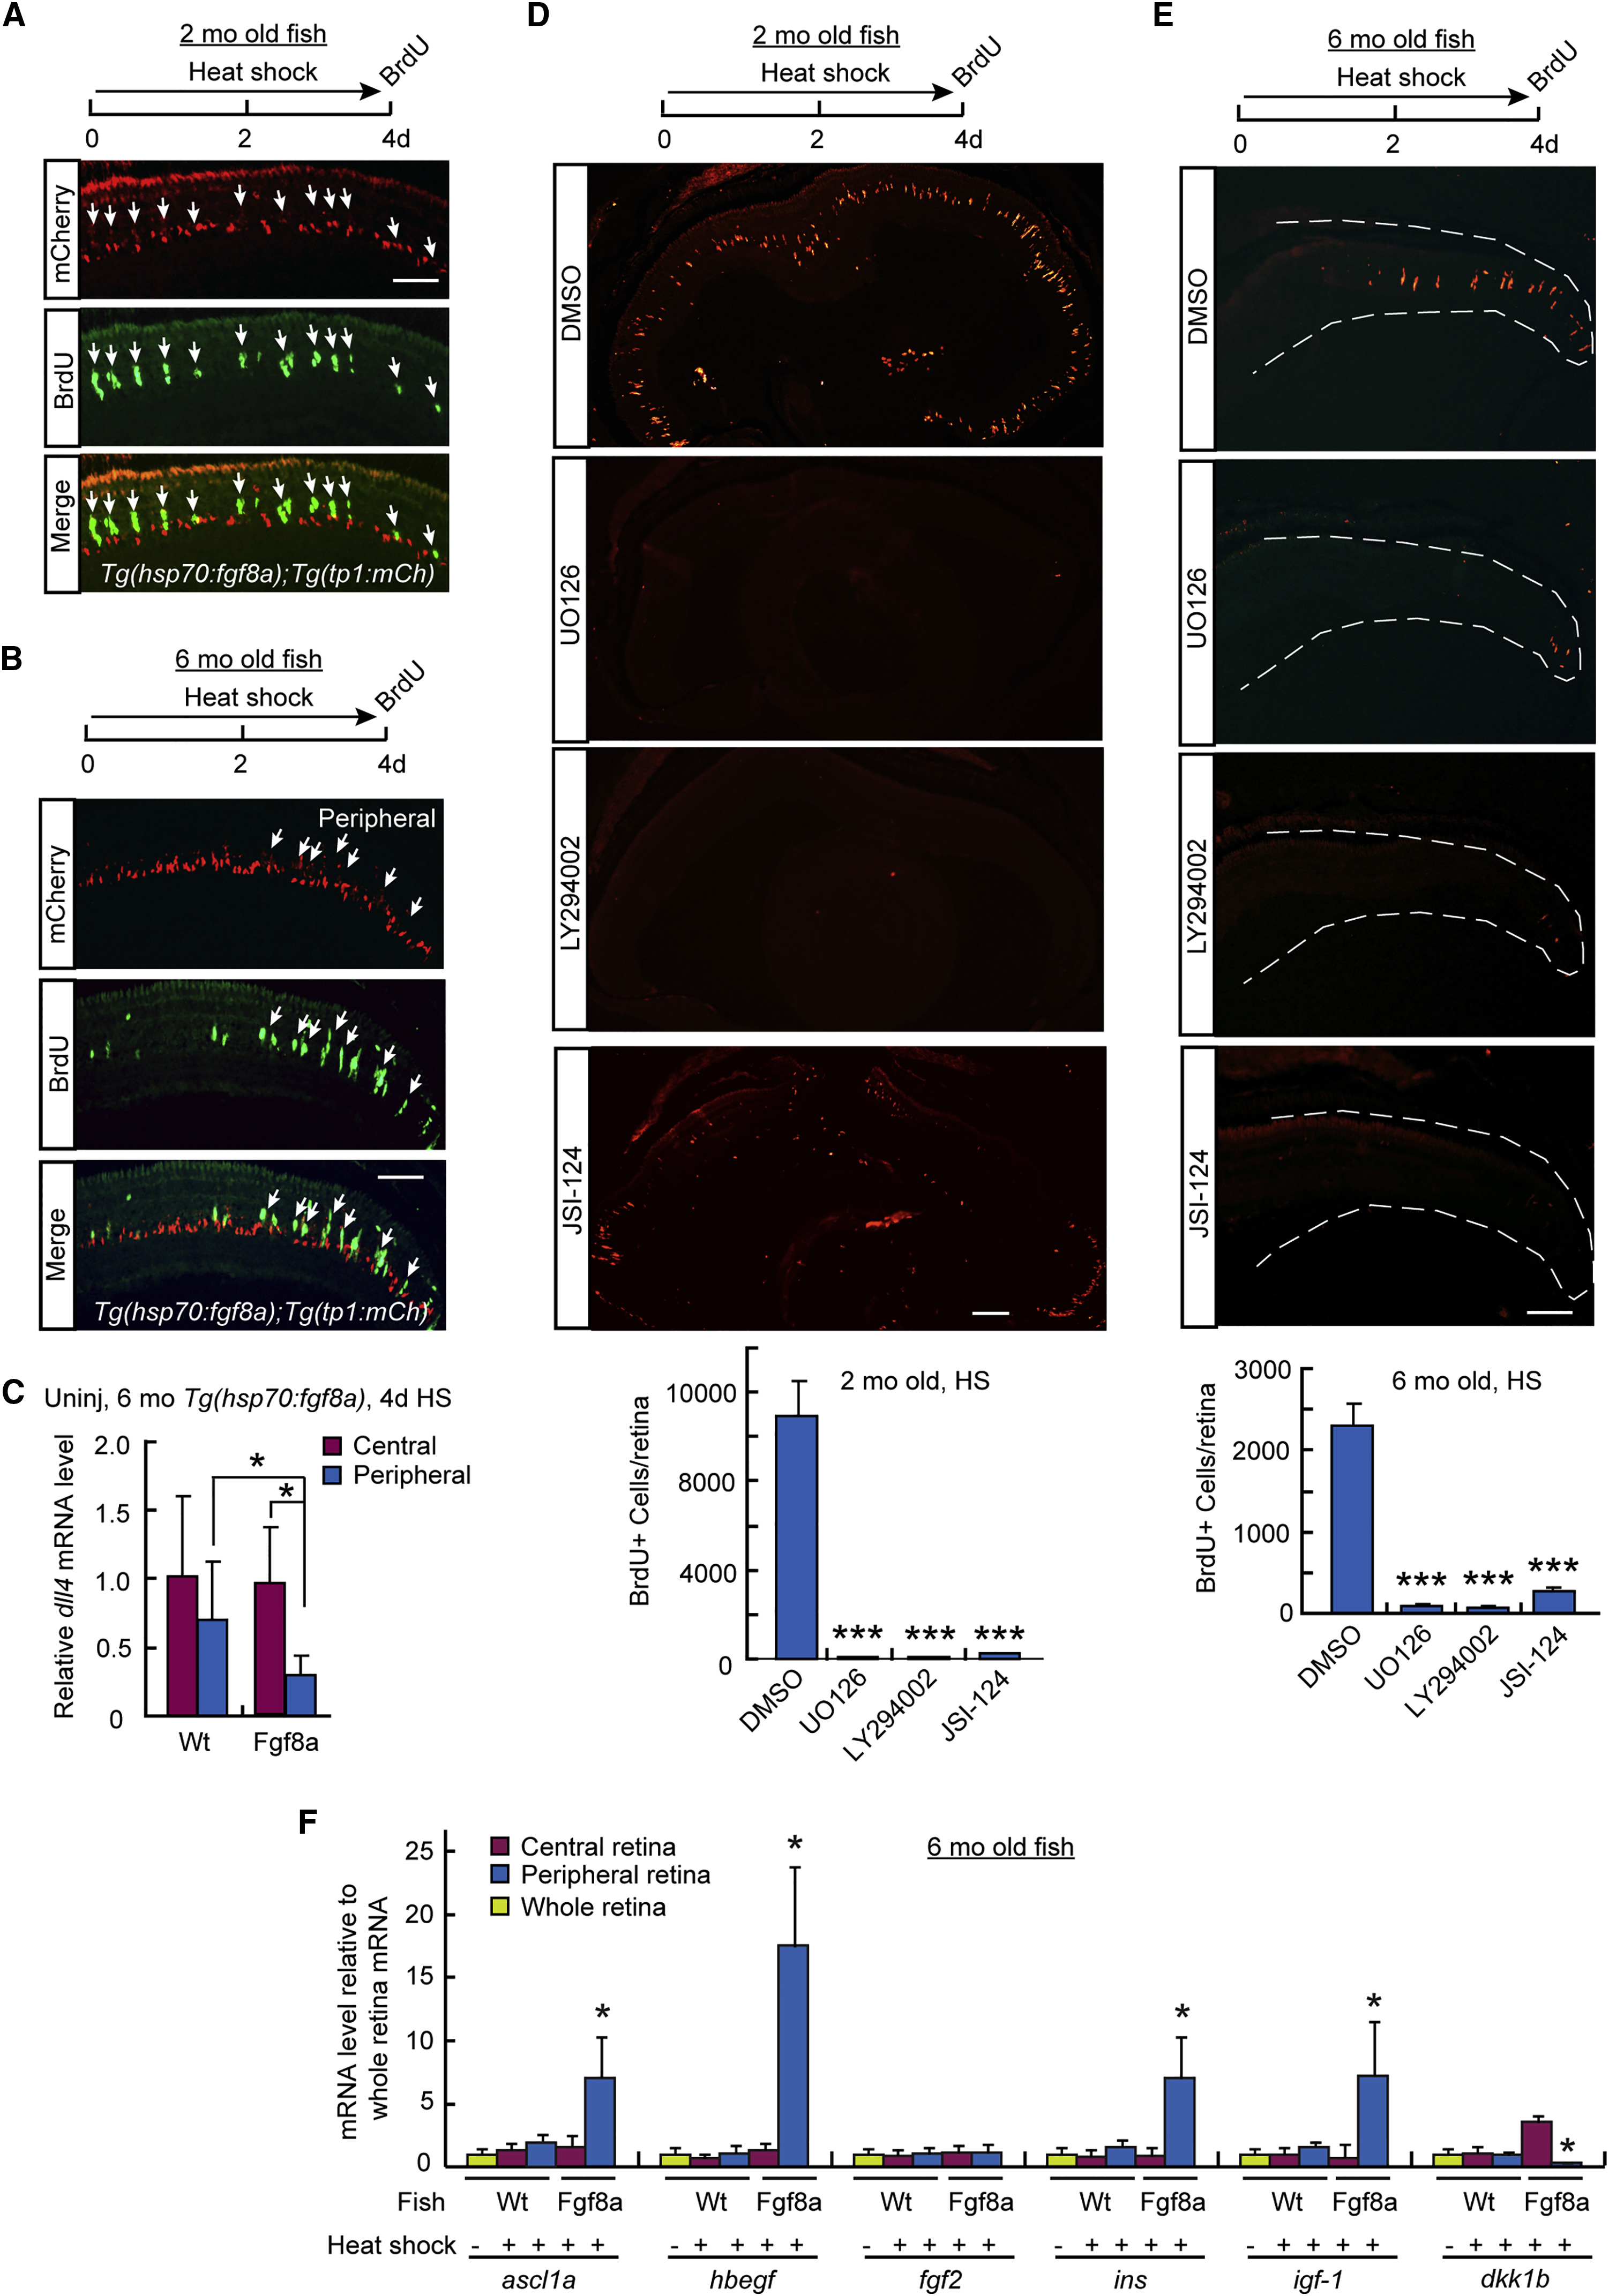
Signaling Pathways Contributing to Fgf8a-Dependent MG Proliferation in the Uninjured Retina
(A and B) mCherry and BrdU immunofluorescence in uninjured retinas from 2-month-old (A) and 6-month-old (B) hsp:70:fgf8a;tp1:mCherry fish that received HS for 4 days (4d). Arrows point to BrdU+/mCherry− cells in the INL of the central retina (A) and retinal periphery (B). Scale bar, 100 μm.
(C) qPCR analysis of dll4 mRNA expression in central retina (2/3) and remaining retinal periphery in WT and hsp70:fgf8a (Fgf8a) fish that received HS for 4 days; n = 3 individual experiments. Error bars indicate SD. ∗p < 0.05. Uninj, uninjured.
(D and E) BrdU immunofluorescence in uninjured retinas from 2-month-old (D) and 6-month-old (E) hsp70:fgf8a fish treated with DMSO, MAPK inhibitor (UO126), PI3K inhibitor (LY294002), or Jak/Stat3 inhibitor (JSI-124). Shown is the whole retina for the 2-month-old fish and the peripheral retina for the 6-month-old fish. Scale bars, 150 μm in (D) and 100 μm in (E). Quantification of BrdU+ cells per retina is shown below the images; n = 3 individual experiments. Error bars indicate SD. ∗∗∗p < 0.001.
(F) qPCR analysis of indicated RNAs isolated from whole retina, central retina (2/3), and remaining peripheral retina of a 6-month-old uninjured WT or hsp70:fgf8a (Fgf8a) fish with and without HS for 4 days before sacrifice; n = 3 individual experiments. Error bars indicate SD. ∗p < 0.05.
See also Figure S6.