
|
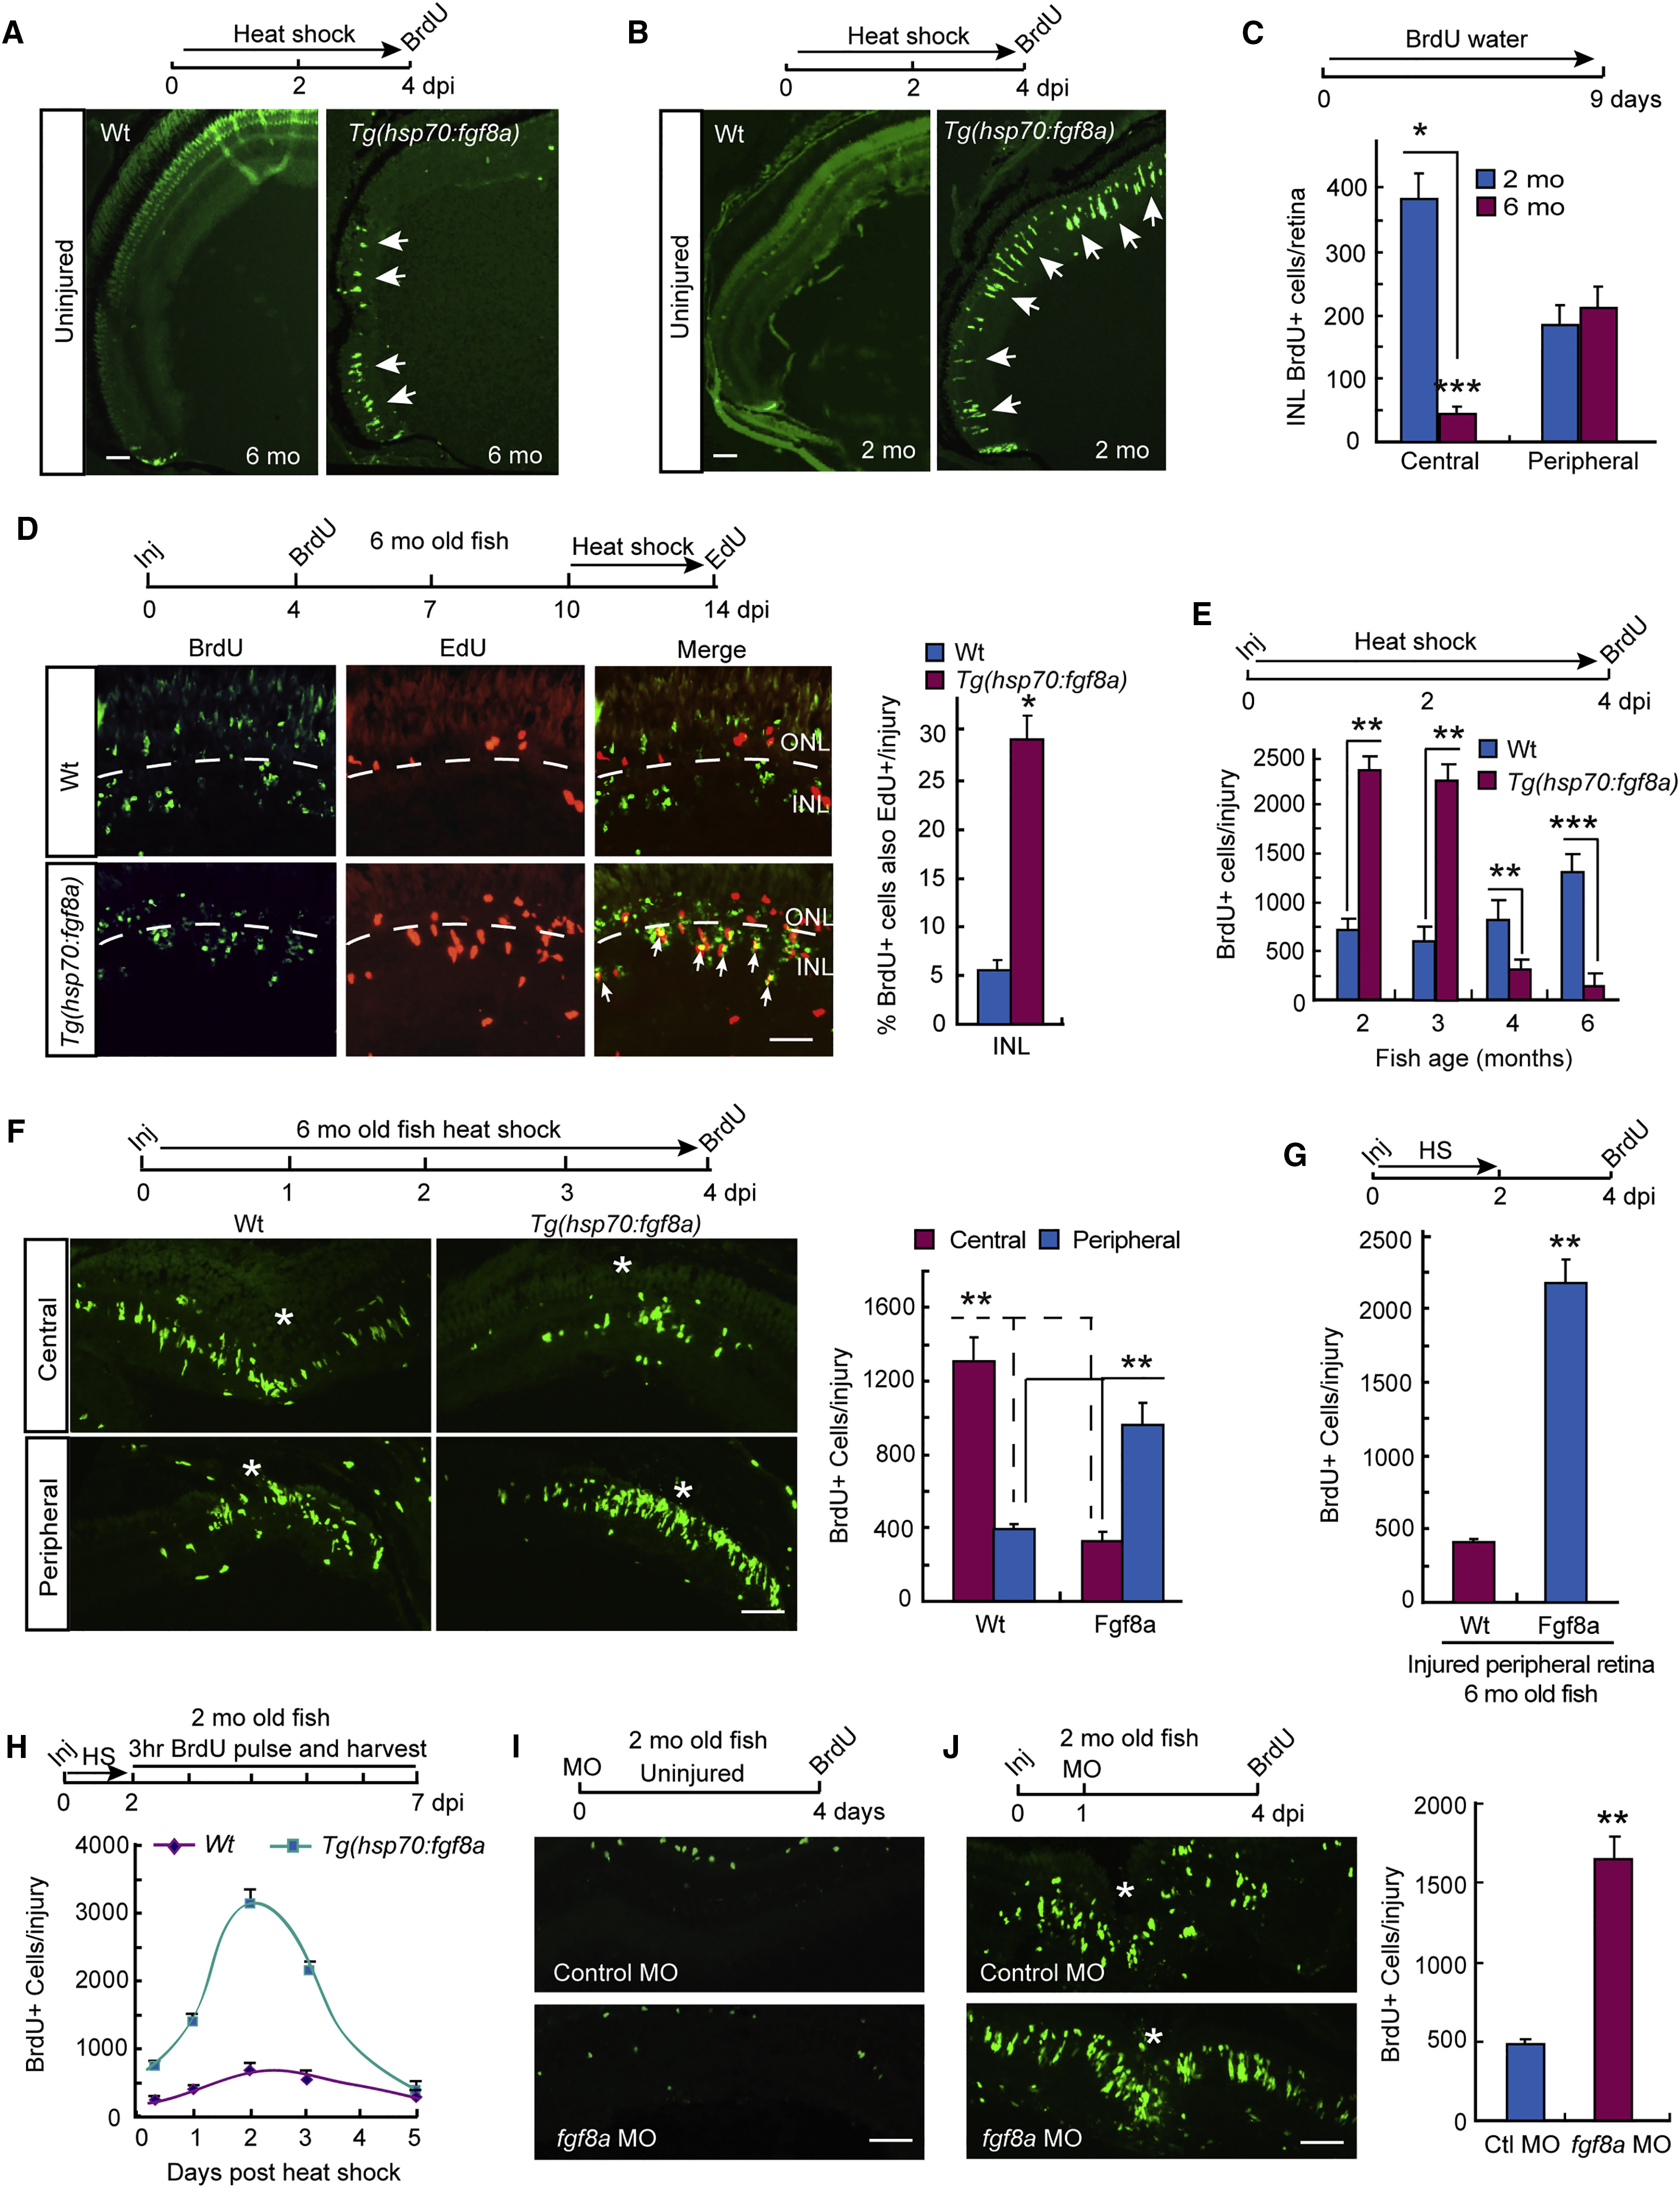
Fig. 5
Age-Dependent Switch in Fgf8a Signaling
(A and B) BrdU immunofluorescence in uninjured retinas from 2- (B) and 6-month-old (A) WT and hsp70:fgf8a fish that received HS for 4 days before sacrifice. Scale bar, 100 μm.
(C) Quantification of spontaneous MG proliferation in the central (2/3) and remaining periphery of 2- and 6-month-old fish retina isolated from WT fish immersed in BrdU-containing water for 9 days; n = 3 individual experiments. Error bars indicate SD. ∗∗∗p < 0.001.
(D) BrdU and Edu immunofluorescence in the injured (Inj) central retina of WT and hsp70:fgf8a fish that received i.p. injections of BrdU and EdU at 4 and 14 dpi, respectively, and received HS from 10 to 14 dpi. Graph is quantification of the percentage of BrdU+ cells that co-label with EdU in the INL. Scale bar, 100 μm; n = 3 individual experiments. Error bars indicate SD. ∗p < 0.05.
(E) Quantification of the number of BrdU+ cells per injury site in retinas from WT and hsp70:fgf8a fish of different ages that received HS for 4 days; n = 3 individual experiments. Error bars indicate SD. ∗∗p < 0.01; ∗∗∗p < 0.001. Inj, injured.
(F) BrdU immunofluorescence in central and peripheral regions of injured retinas from WT and hsp70:fgf8a fish that received HS for 4 days. Asterisk indicates injury site. Scale bar, 100 μm. Graph is quantification of BrdU+ cells per injury site; n = 3 individual experiments. Error bars indicate SD. ∗∗p < 0.01.
(G) Quantification of BrdU+ cells per injury site in peripheral retinas from WT and hsp70:fgf8a fish that received HS for 2 dpi and then BrdU at 4 dpi. Values are the difference between injured fish and uninjured fish; n = 3 individual experiments. Error bars indicate SD. ∗∗p < 0.01.
(H) Quantification of BrdU immunofluorescence in injured 2-month-old WT and hsp70:fgf8a fish retinas that received HS for 2 days and were then sacrificed 3 hr after an i.p. injection of BrdU at the indicated times post-HS; n = 3 individual experiments. Error bars indicate SD.
(I and J) BrdU immunofluorescence in uninjured (I) and injured (J) 2-month-old WT fish retina electroporated with control and fgf8a-targeting MO at the indicated times. Asterisk in (J) indicates injury site. Scale bars, 100 μm. Graph in (J) is quantification of proliferating MGs in injured retina treated with control and fgf8a-targeting MO; n = 3 individual experiments. Error bars indicate SD. ∗∗p < 0.01.
See also Figure S5.