
Image
|
Figure Caption
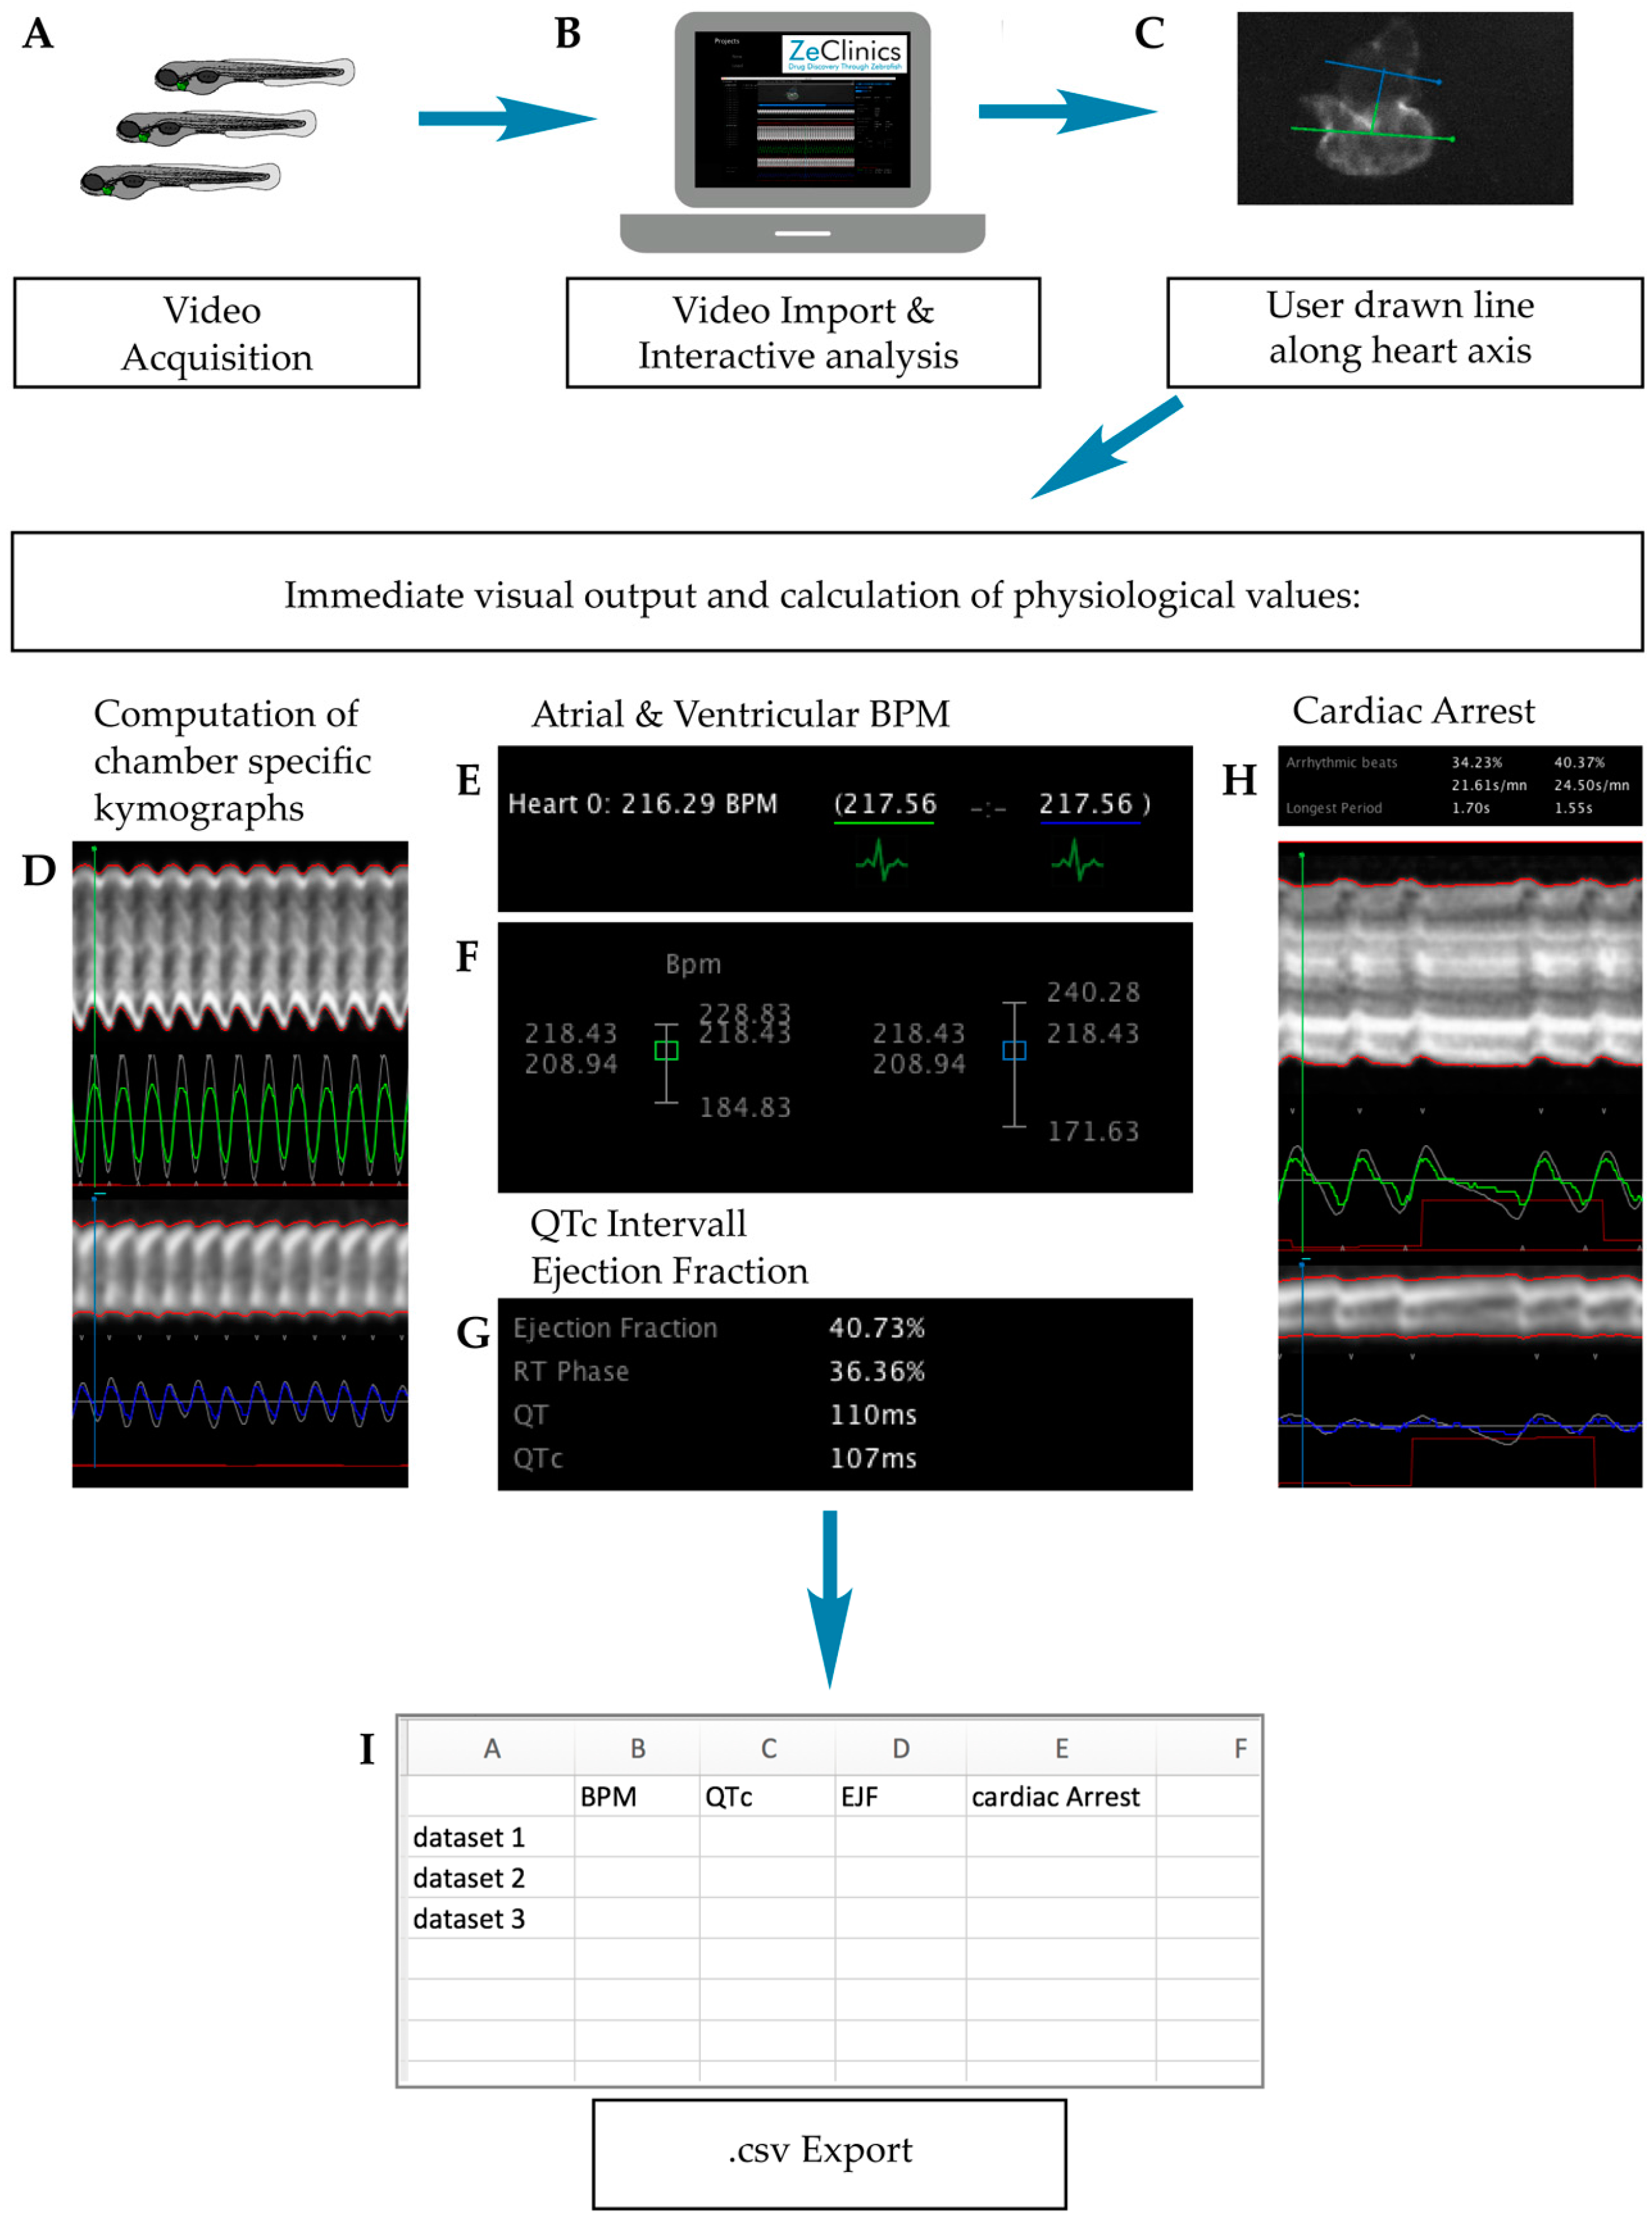
Fig. 6
ZeCardio β software user pipeline. (A) Video acquisition of larvae incubated with the candidate drug; (B) Video import into the software; (C) User drawn line along the heart axis; (D–H) GUI (Graphical User Interface) display of (D) Chamber kymographs; (E) atrial and ventricular BPM (Beats Per Minute) values; (F) Distribution plot over time of atrial and ventricular BPM; (G) QTc interval and EJF (Ejection Fraction) values and (H) Cardiac arrest events; (I) Output values are presented in .csv format. Kymographs and measurements are displayed in green or blue for ventricle or atrium respectively.
Acknowledgments
This image is the copyrighted work of the attributed author or publisher, and
ZFIN has permission only to display this image to its users.
Additional permissions should be obtained from the applicable author or publisher of the image.
Full text @ Int. J. Mol. Sci.