
|
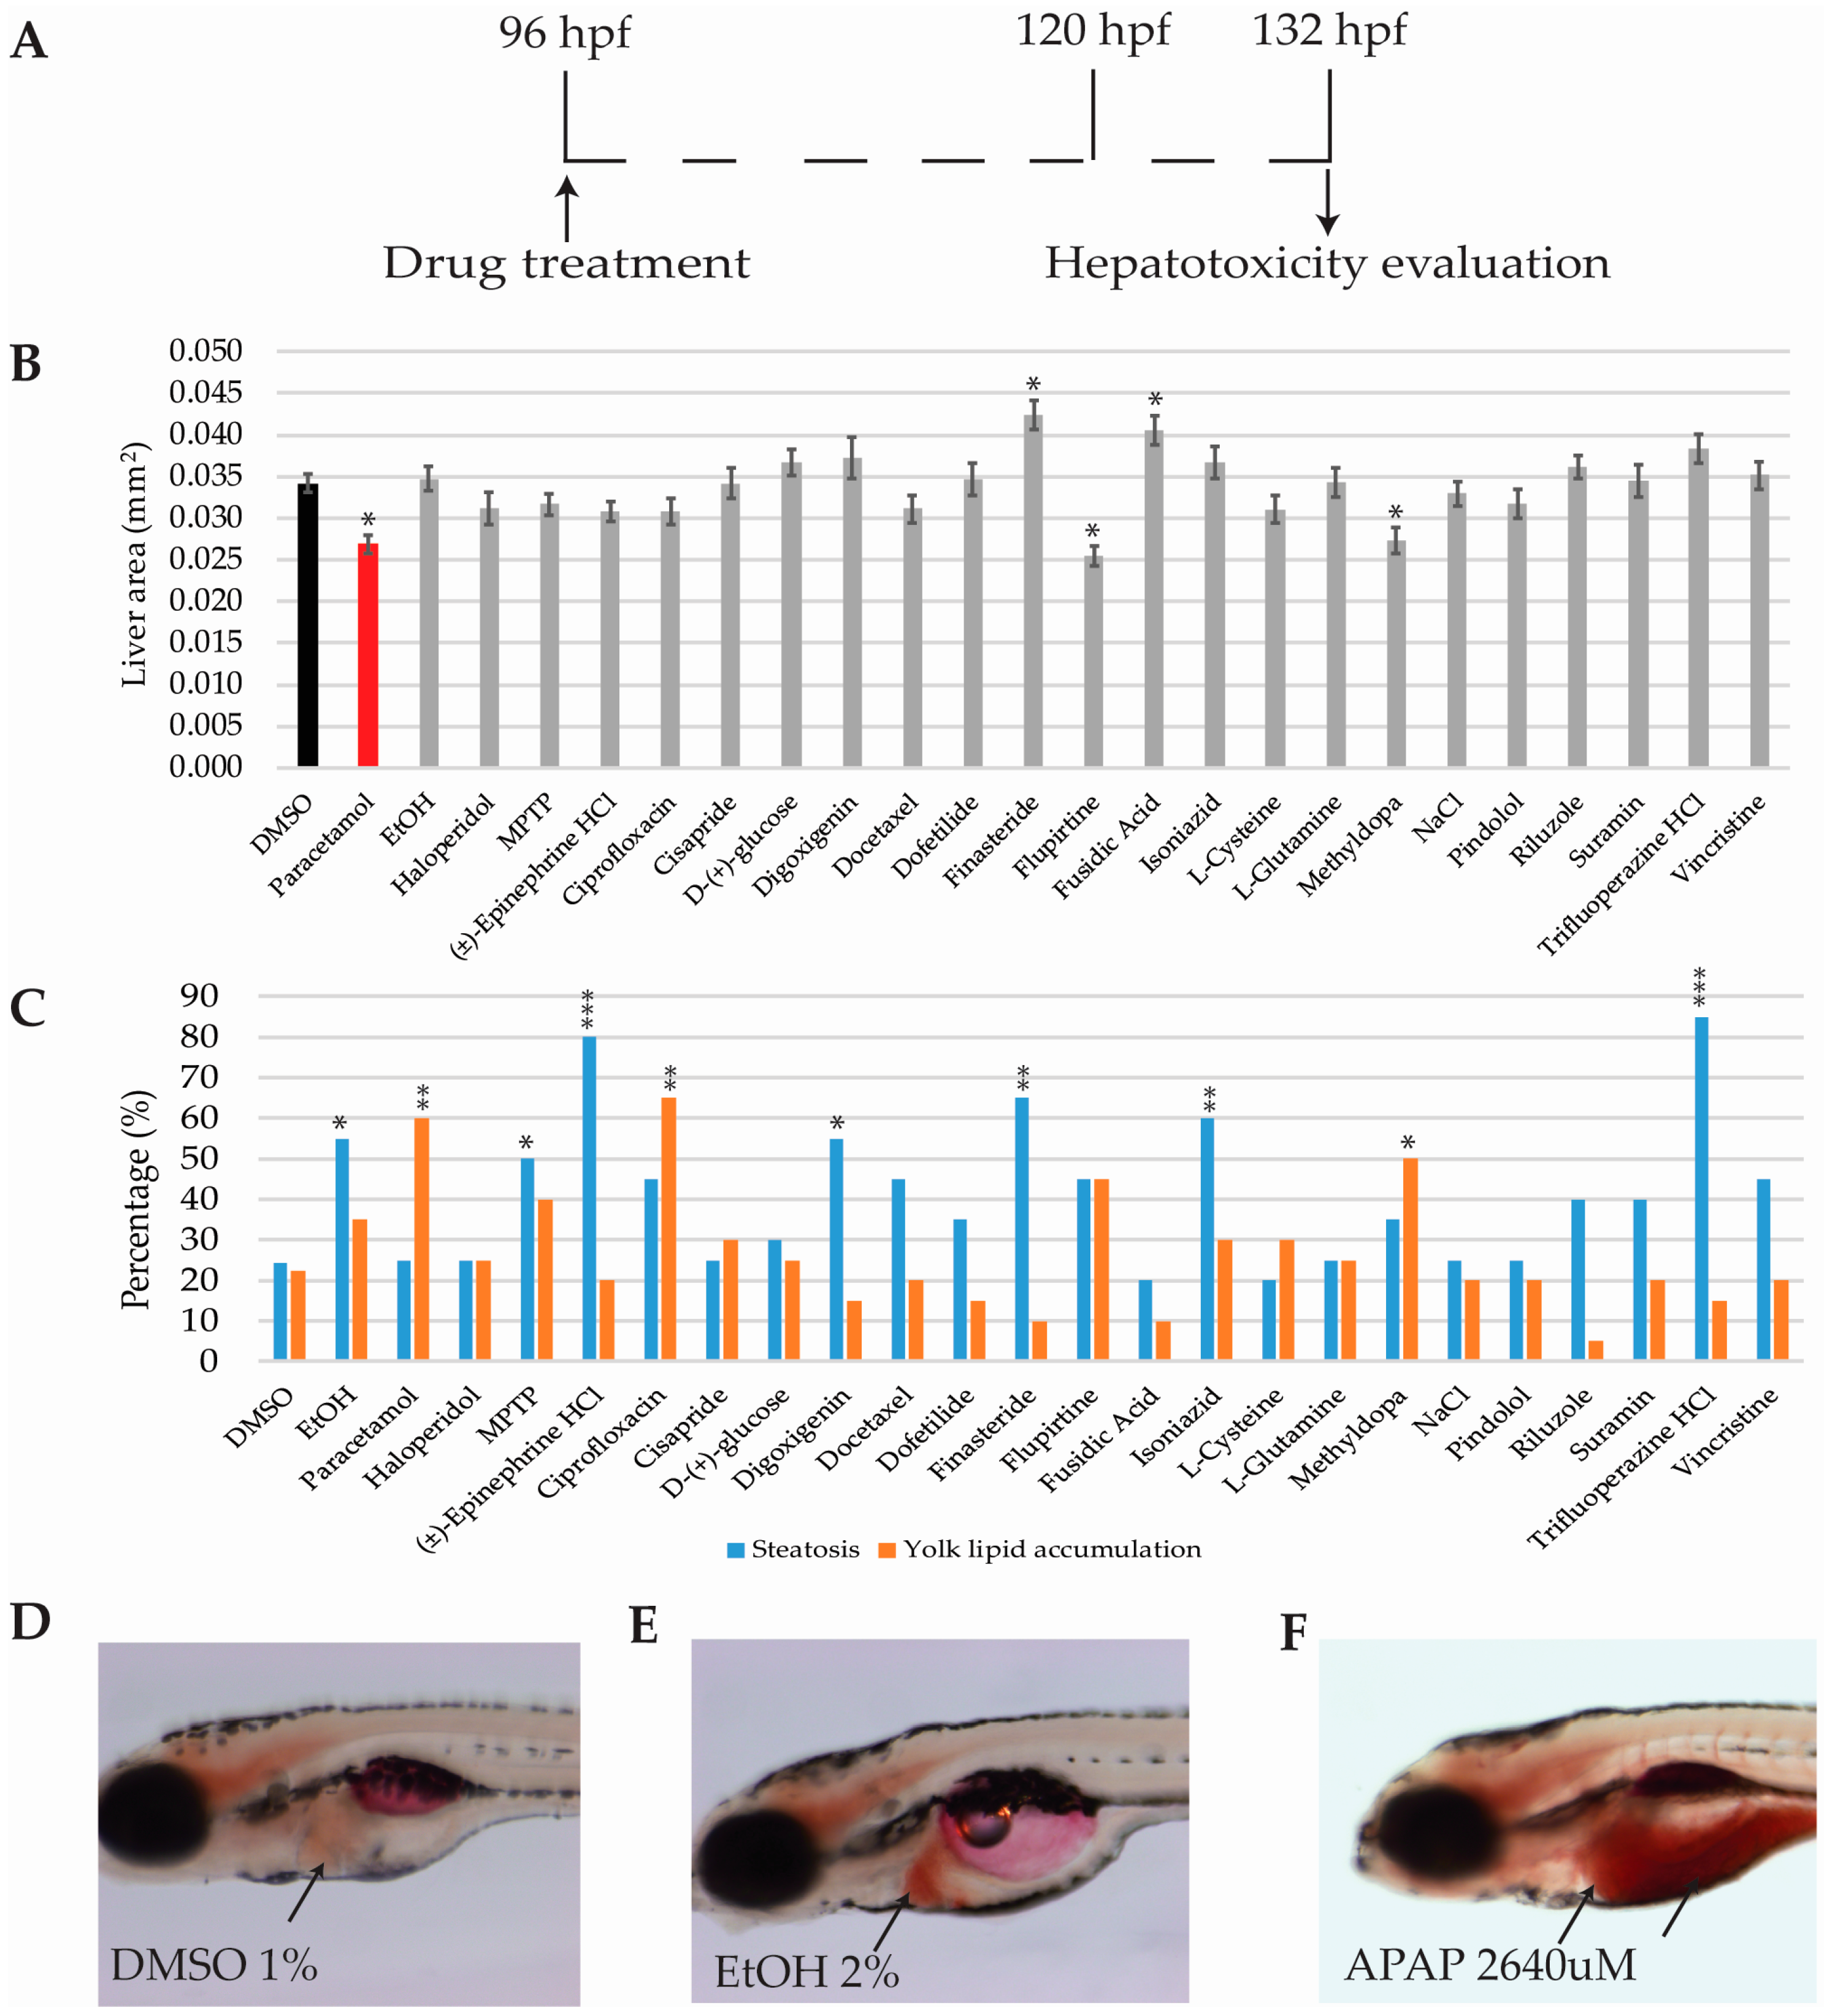
Fig. 5
Hepatotoxicity results (A) Scheme of the experimental procedure (B). Bar graphs showing average liver area in mm. (C) Bar graphs showing the percentage of larvae presenting steatosis or yolk lipid accumulation after oil red O stain (D–F) Representative oil red O whole mount staining images of (D) DMSO, (E) EtOH and (F) APAP; black arrows point at non-affected liver (D), liver with steatosis (E), and yolk lipid retention (F), respectively. Asterisks indicate statistical significance after One-way ANOVA (liver area) or Fisher’s exact test (steatosis and yolk lipid retention): * p < 0.05; ** p < 0.01; *** p < 0.001. Black bar: negative control (B). Red bar: positive control (B). n = 20 but for DMSO n = 45.