
|
Fig. S8
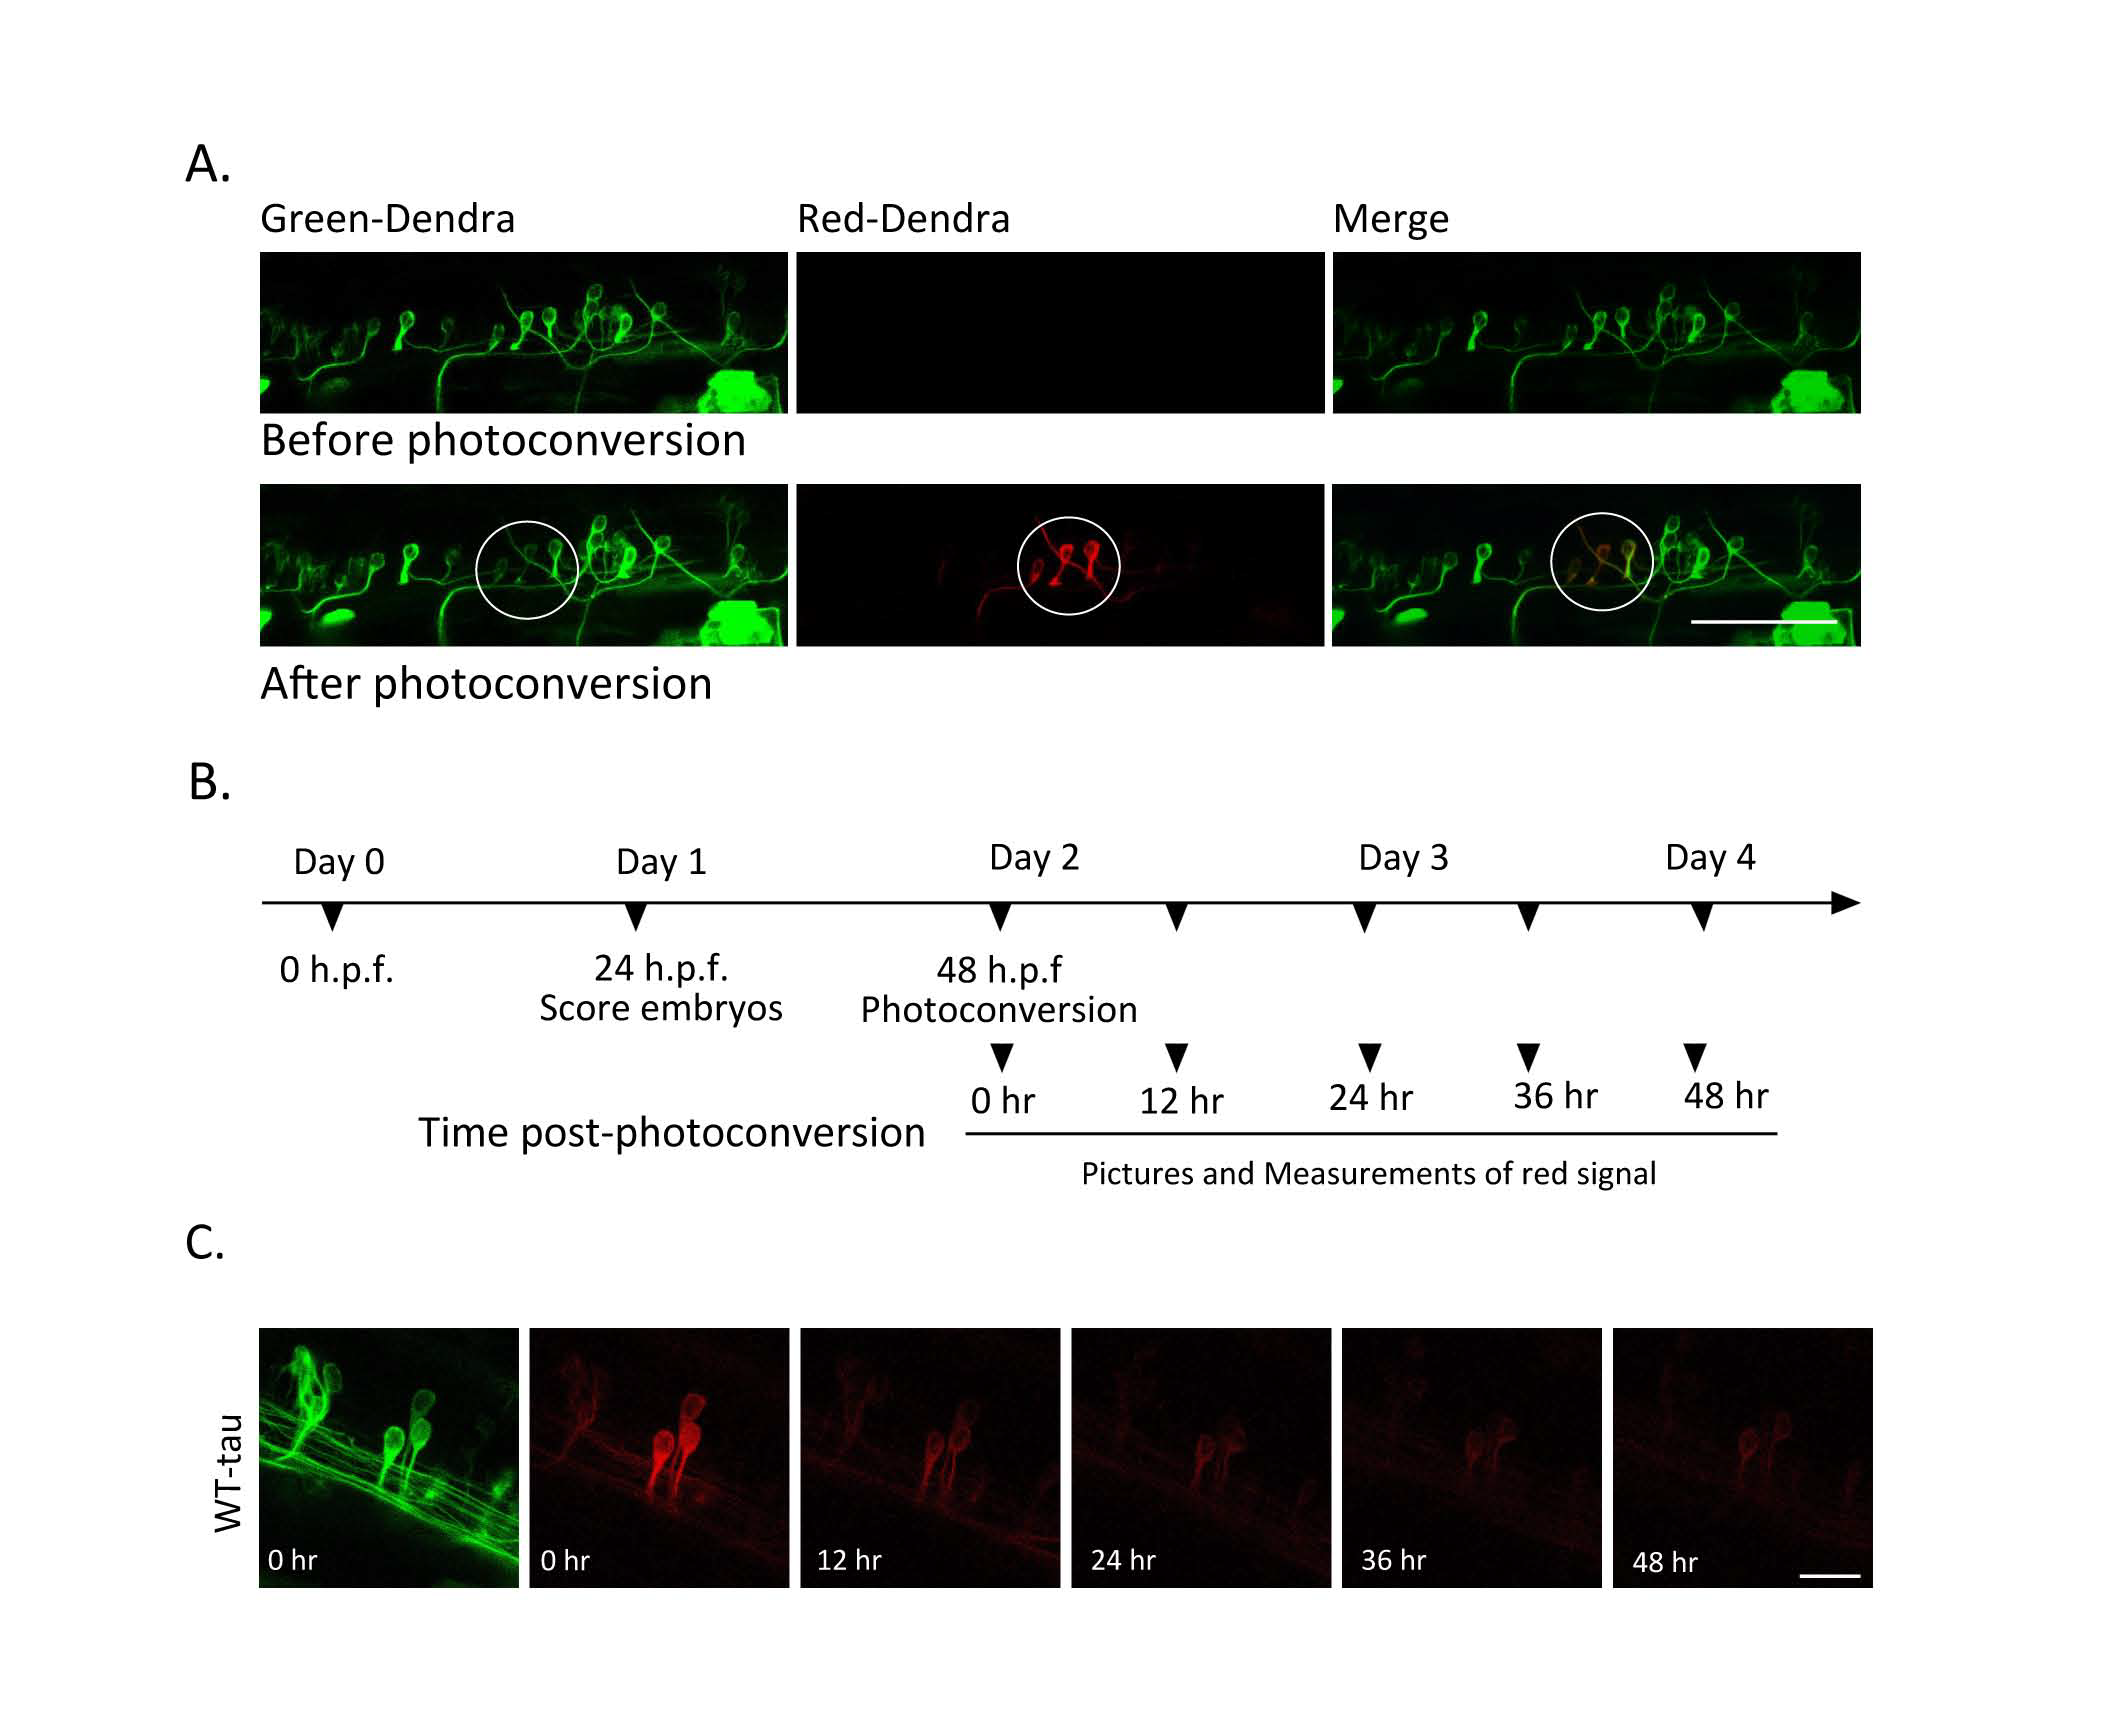
Dendra-photoconversion protocol (A) Photoconversion of Dendra: Confocal images of green Dendra-tau and red Dendra-tau before and after photoconversion of spinal cord motor neurons of WT-tau fish. The circle indicates the area targeted for photoconversion with 405nm laser. Scale bar represents 50 μm. (B) Schematic diagram of the photoconversion protocol. On day 1, fish were screened at 24 h.p.f to identify those with mosaic Dendra-tau expression. On day 2, individual neurons in the spinal cord were exposed to 405nm light for 3 sec to photoconvert the green-Dendra into red- Dendra. Pictures of redDendra-tau signal were taken immediately after photoconversion (to obtain an image of the maximum red signal) and subsequently at 12, 24, 36 and 48 hr postphotoconversion. (C) Clearance of red-Dendra-tau signal: confocal images of photoconverted neurons in WT-tau fish immediately after photoconversion and at 12, 24, 36 and 48 hours later. Intensity of the red signal was then analysed using FIJI software. A & C Scale bar represents 10 μm.