
|
Fig. S5
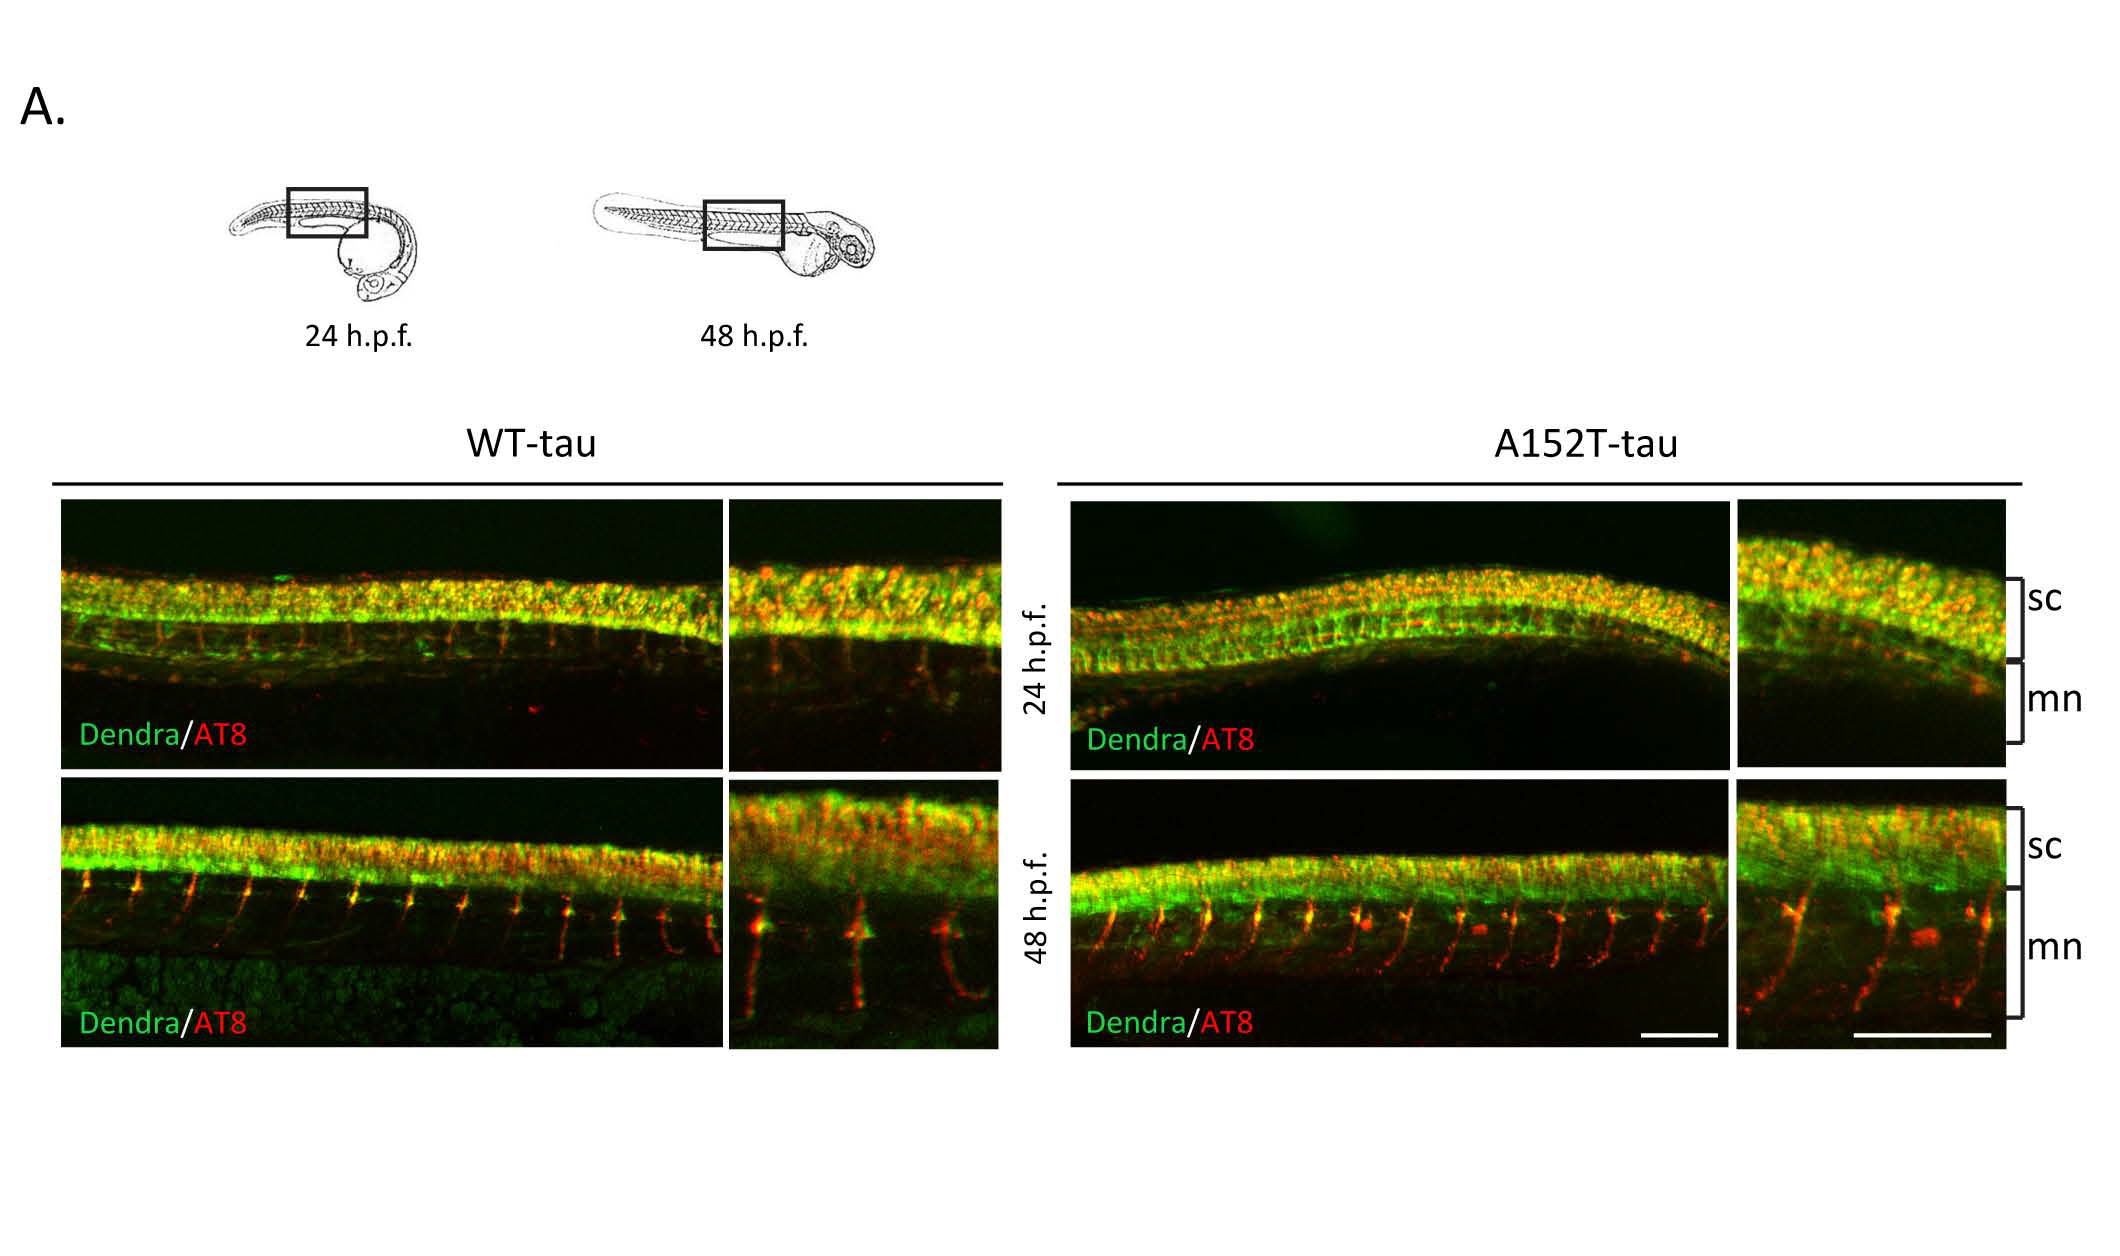
Dendra-tau phosphorylation in transgenic zebrafish Further data supporting main Fig.3. (A) Representative images of whole-mount immunostaining for the hyperphosphorylation marker AT8 at 24 and 48 h.p.f. in the areas represented in schematic overviews above. Pictures show Dendra signal (green) and positive AT8 staining (red) in both WT- and A152T-tau larvae from 24 h.p.f. Pictures at higher magnification demonstrate the presence of hyperphosphorylated tau in somas of individual motorneurons in the spinal cord (sc) as well as their axonal projections. At 48 h.p.f, the staining was greater in the axons. Scale bar represents 150 μm.