
Image
|
Figure Caption
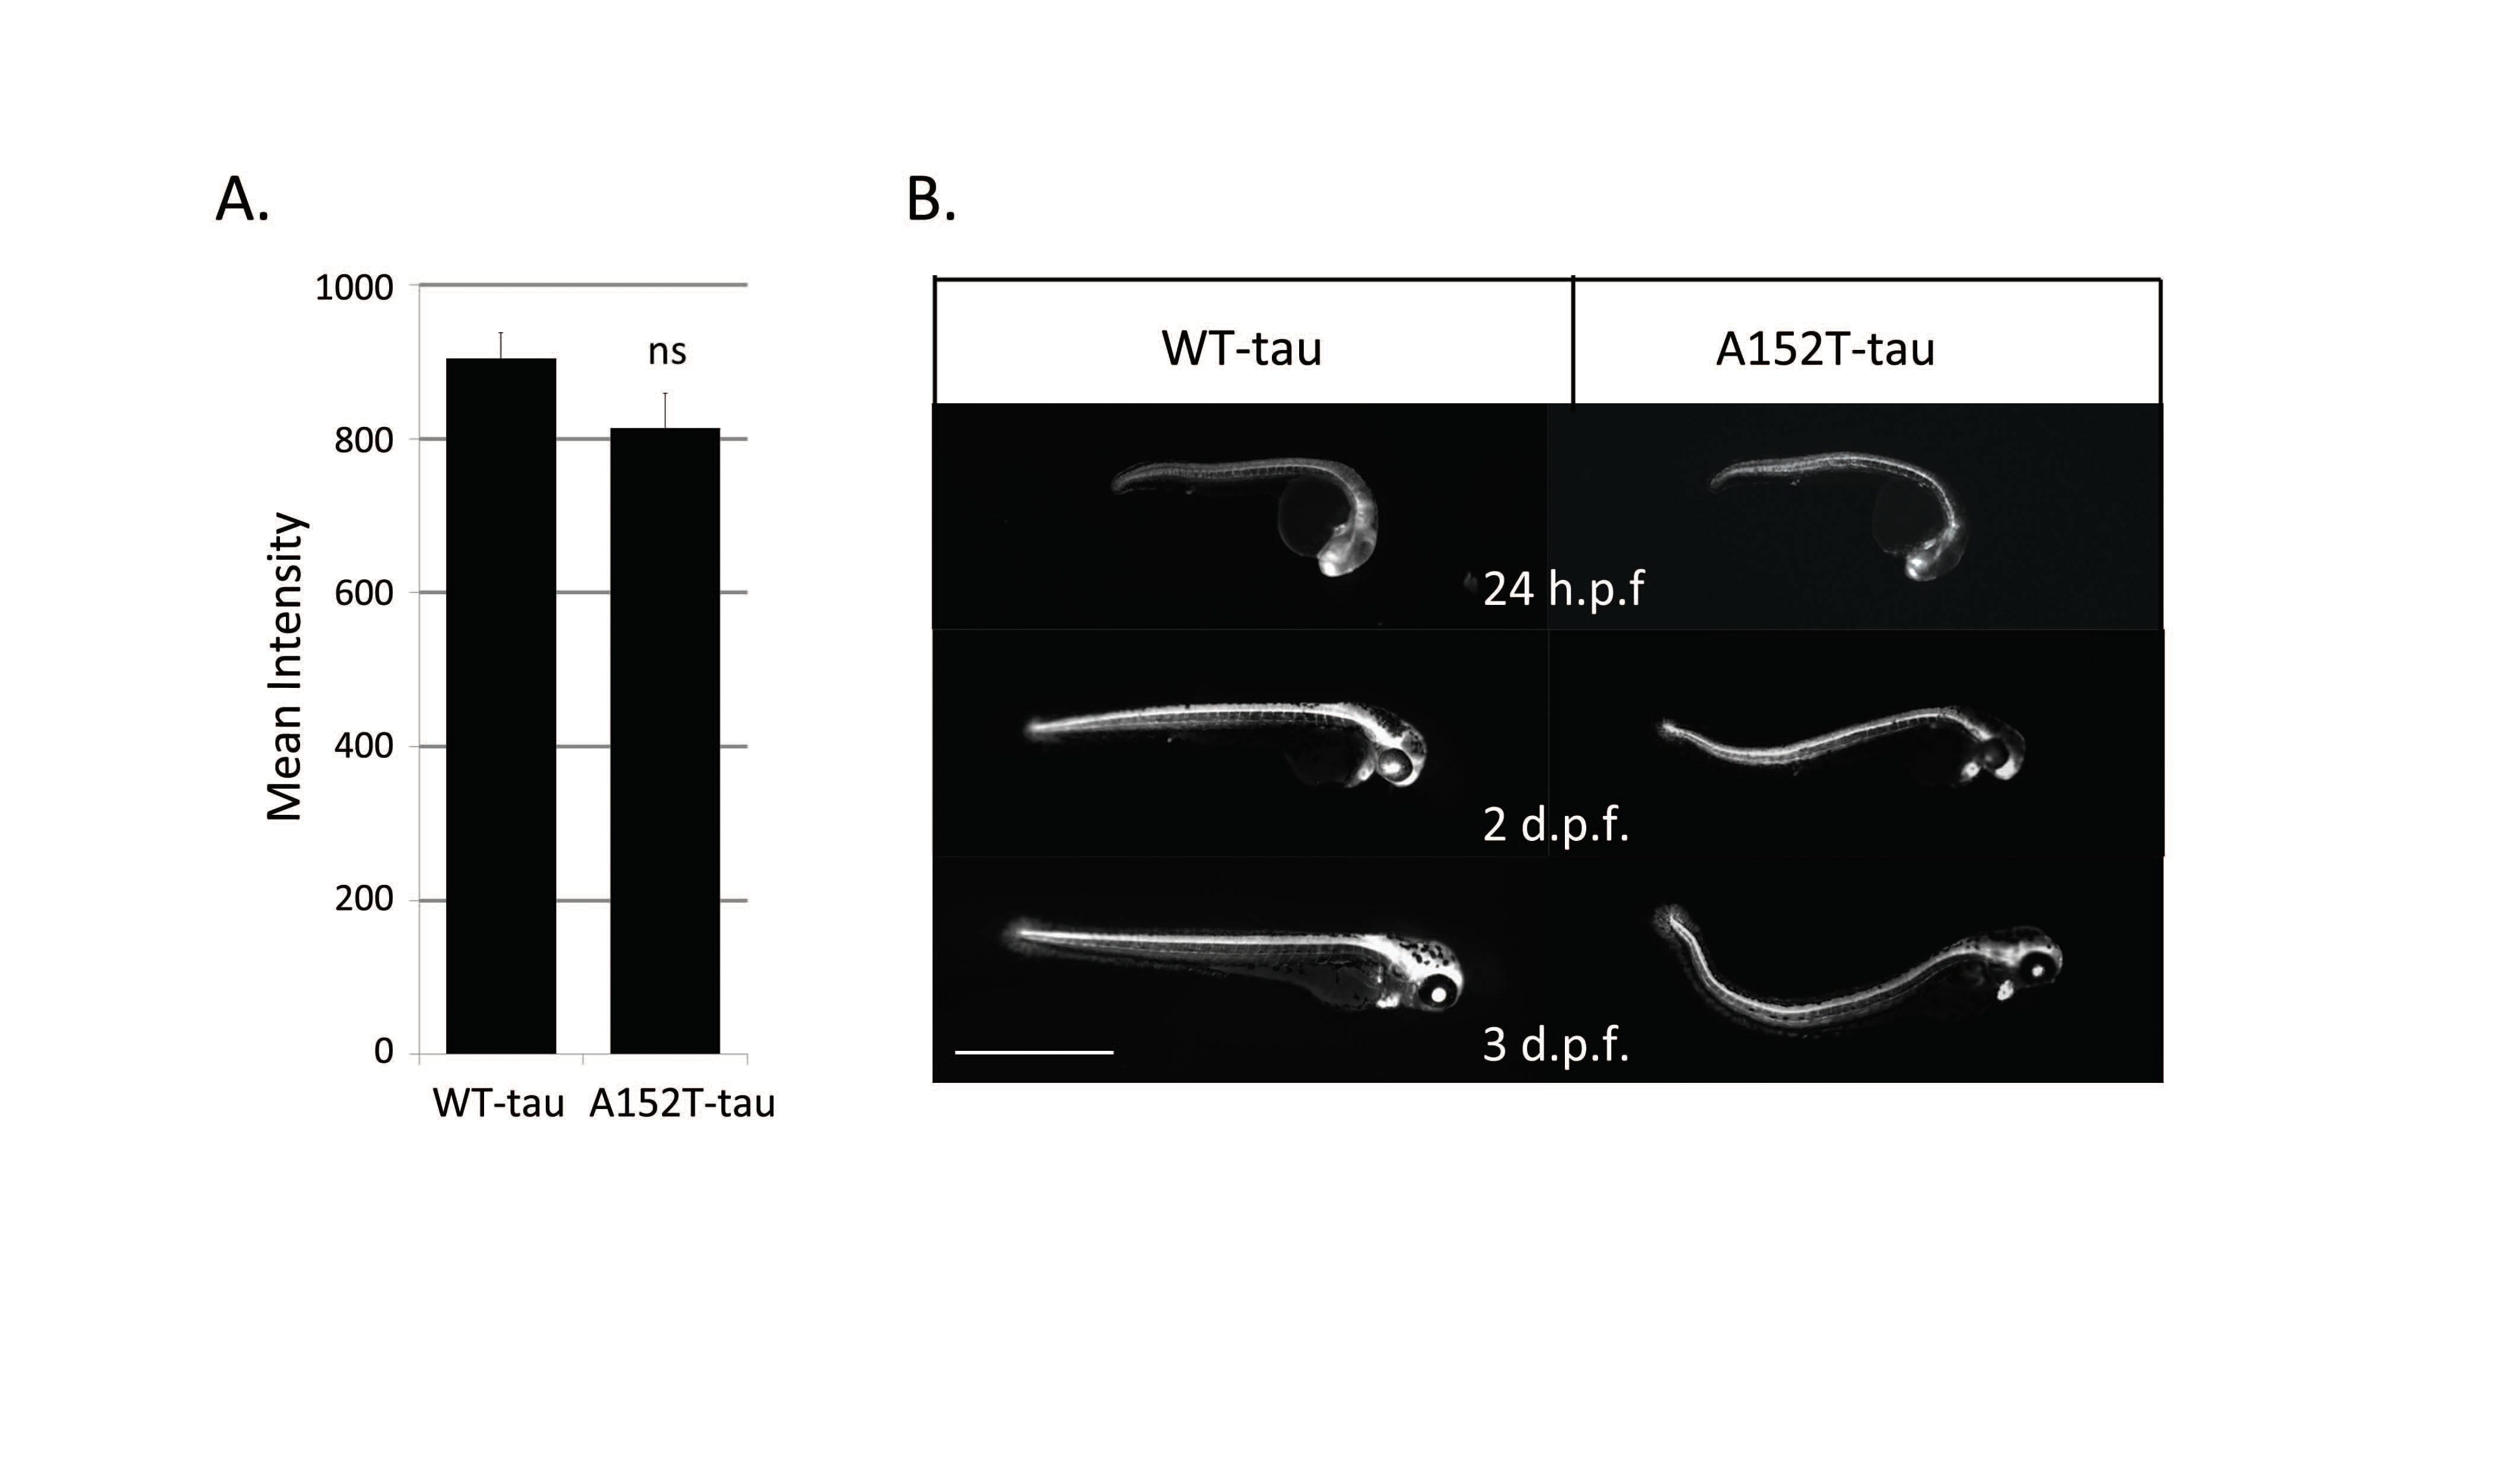
Fig. S3
Dendra-intensity levels in Dendra-tau fish (A) Quantification of the mean fluorescent intensity of Dendra in WT-tau and A152T-tau fish shows no significant differences at 24 h.p.f. (pre-phenotype) and fluorescent intensity does not correlate with the onset of morphological abnormalities in A152T-tau fish. (B) Images of WTtau and A152T-tau fish sorted for similar initial Dendra fluorescent intensity at 24 h.p.f and followed over subsequent days. Only fish expressing A152T-tau developed abnormal phenotype. Scale bar represents 1 mm.
Acknowledgments
This image is the copyrighted work of the attributed author or publisher, and
ZFIN has permission only to display this image to its users.
Additional permissions should be obtained from the applicable author or publisher of the image.
Full text @ Brain