
|
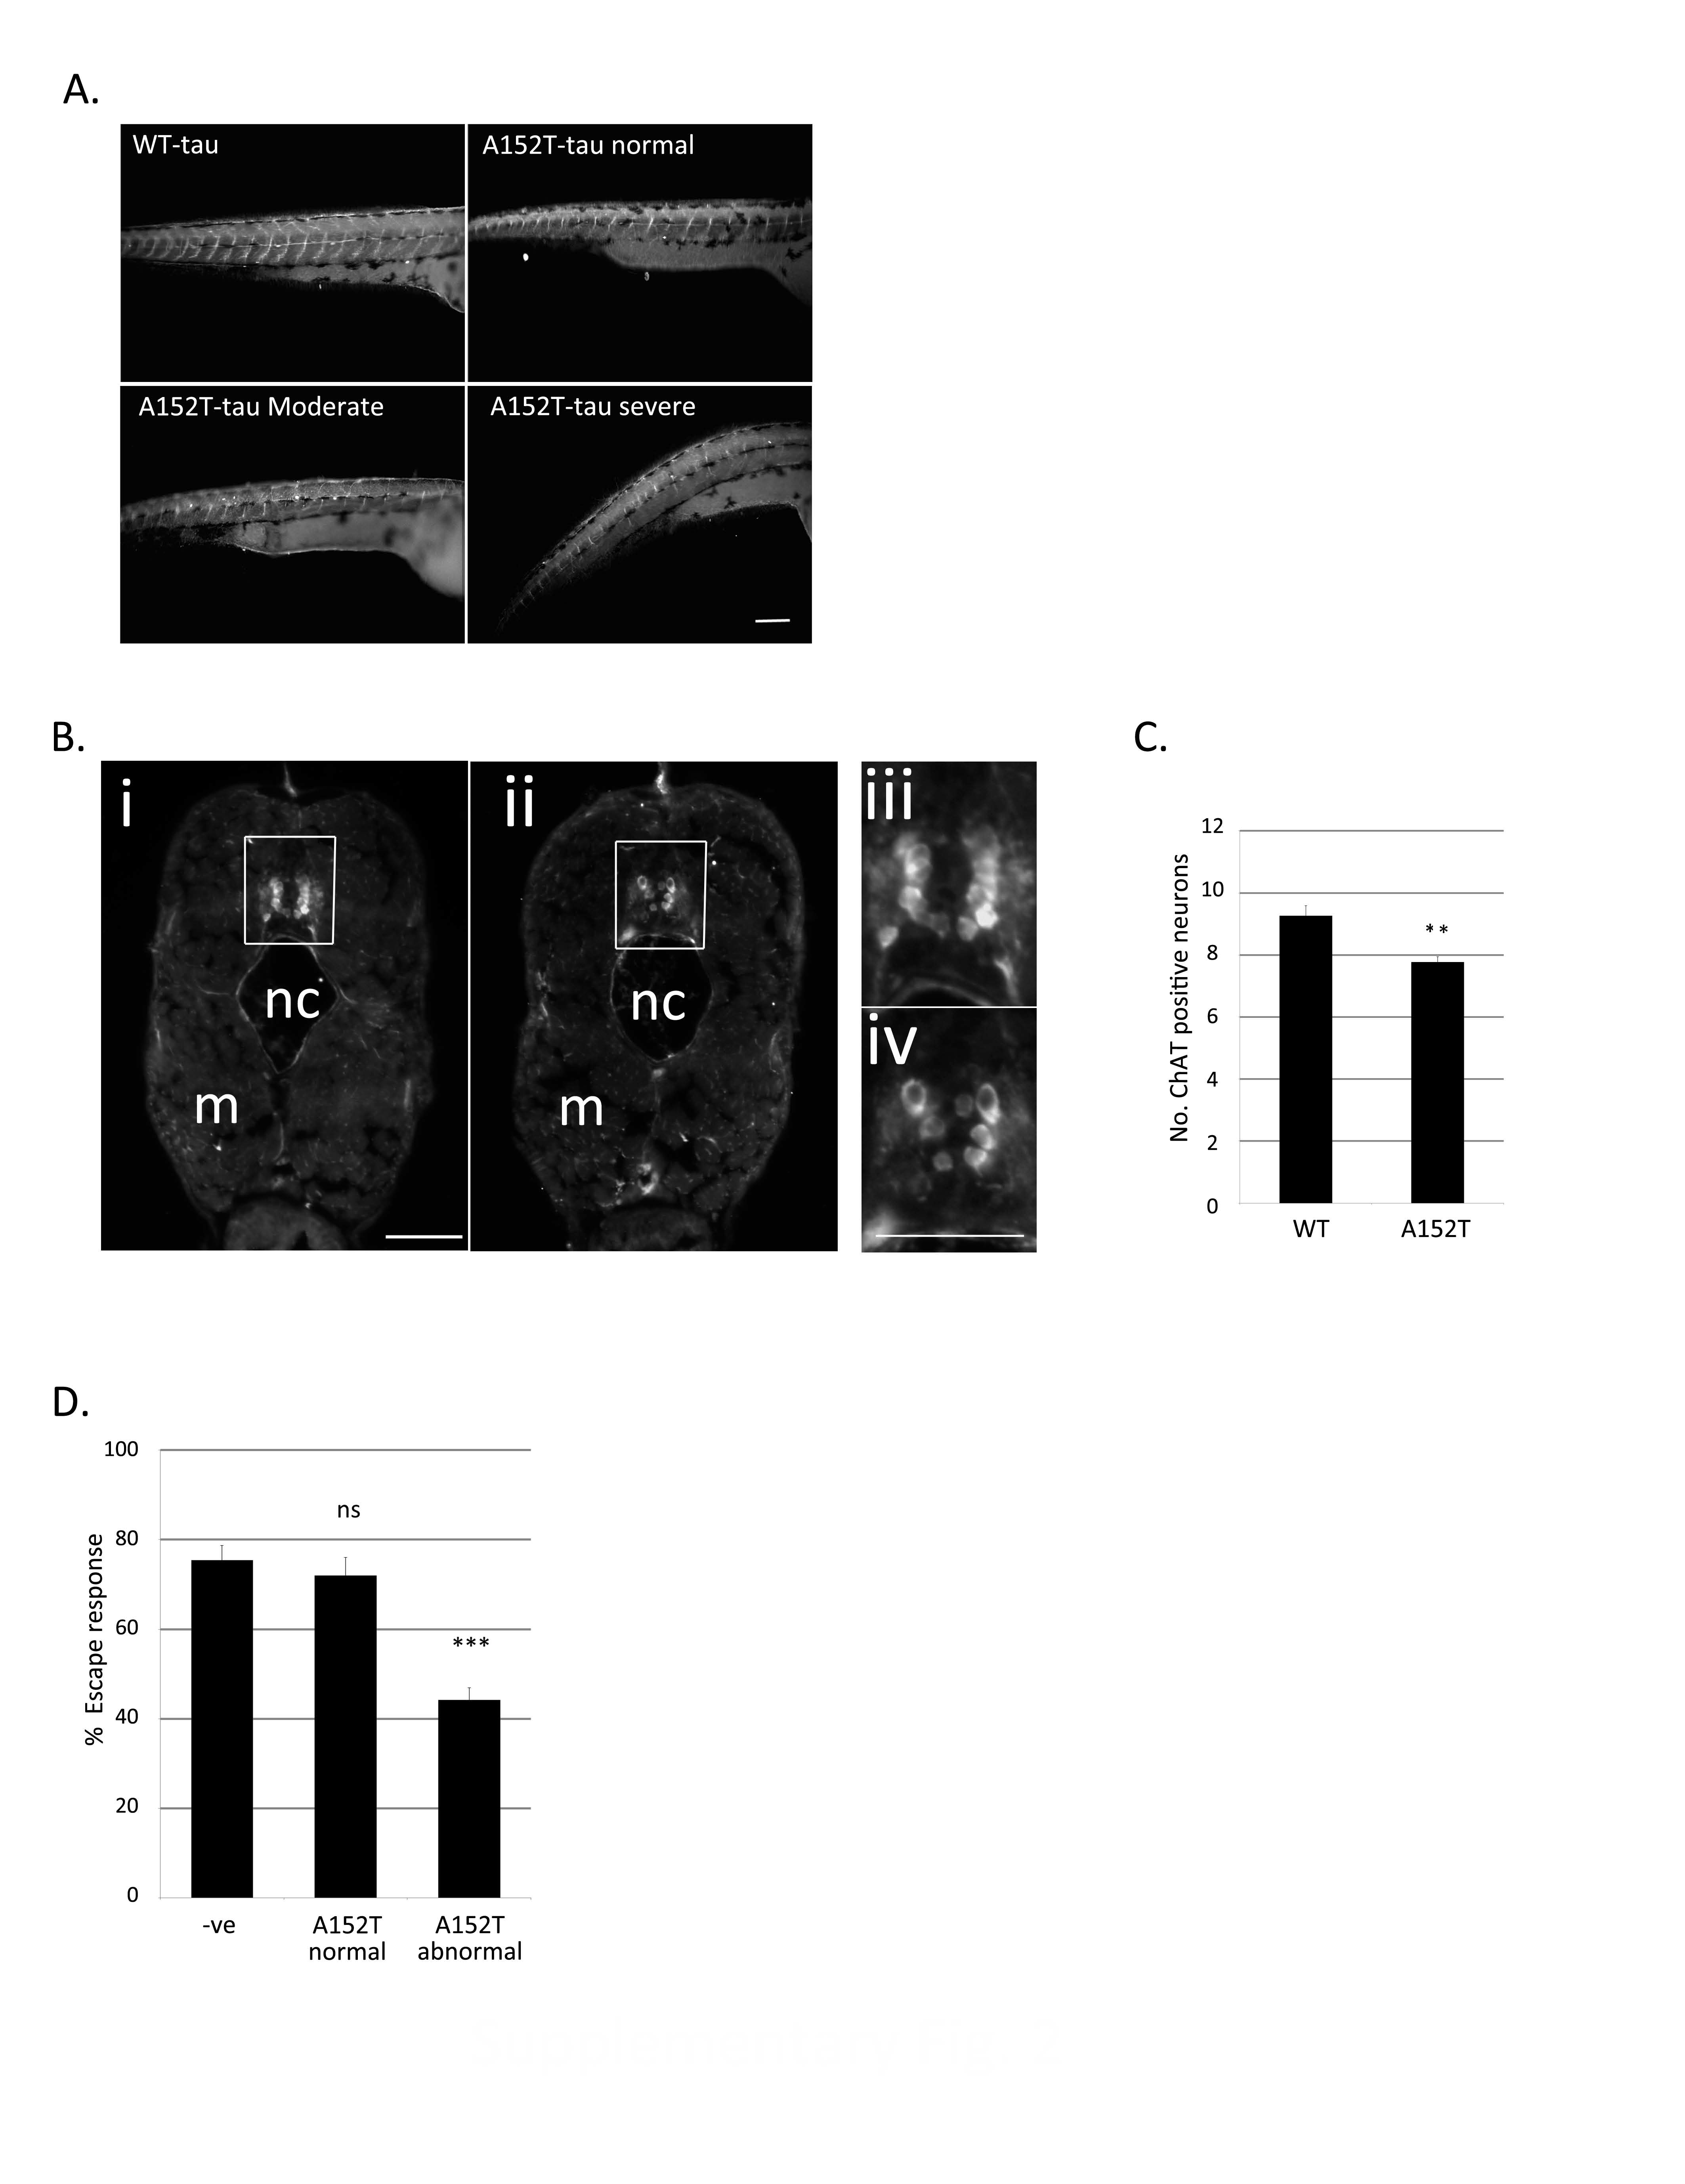
Fig. S2
Cholinergic denervation in Dendra-tau fish (A) Antibody staining for alpha-acetylated tubulin in 3 d.p.f. WT-tau and A152T-tau fish visualise abnormalities in branching of motor neurons (supporting main figure Fig.2B&C). Scale bar represents 100 μm. (B) Representative images showing the loss of cholinergic (motor) neurons in the spinal cord (squared area) of A152T-tau fish compared to WT-tau by immunostaining with ChAT antibody (6 d.p.f.) (nc=notochord; m=muscle). Images iii and iv show high magnification regions of the spinal cord. Scale bar represents 50 μm. (C) Quantification of the number of ChAT-positive motor neurons across 20 sections of the spinal cord from the dorsal fin region (mean ± standard error, N=5 fish/group; two-tailed t-test, **P<0.01 vs. WT-tau). (D) Quantification of the escape response of mutant A152T-tau fish or Dendra-negative siblings at 3 d.p.f showing that defects are observed at 3 dp.f. in addition to those reported at 6 d.p.f. in Figure 2D (3 independent experiments in triplicate, N=20/group shown as mean ± standard error; ***P<0.001 vs. negative siblings by two-tailed t-test).