
Fig. 3
|
Fig. 3
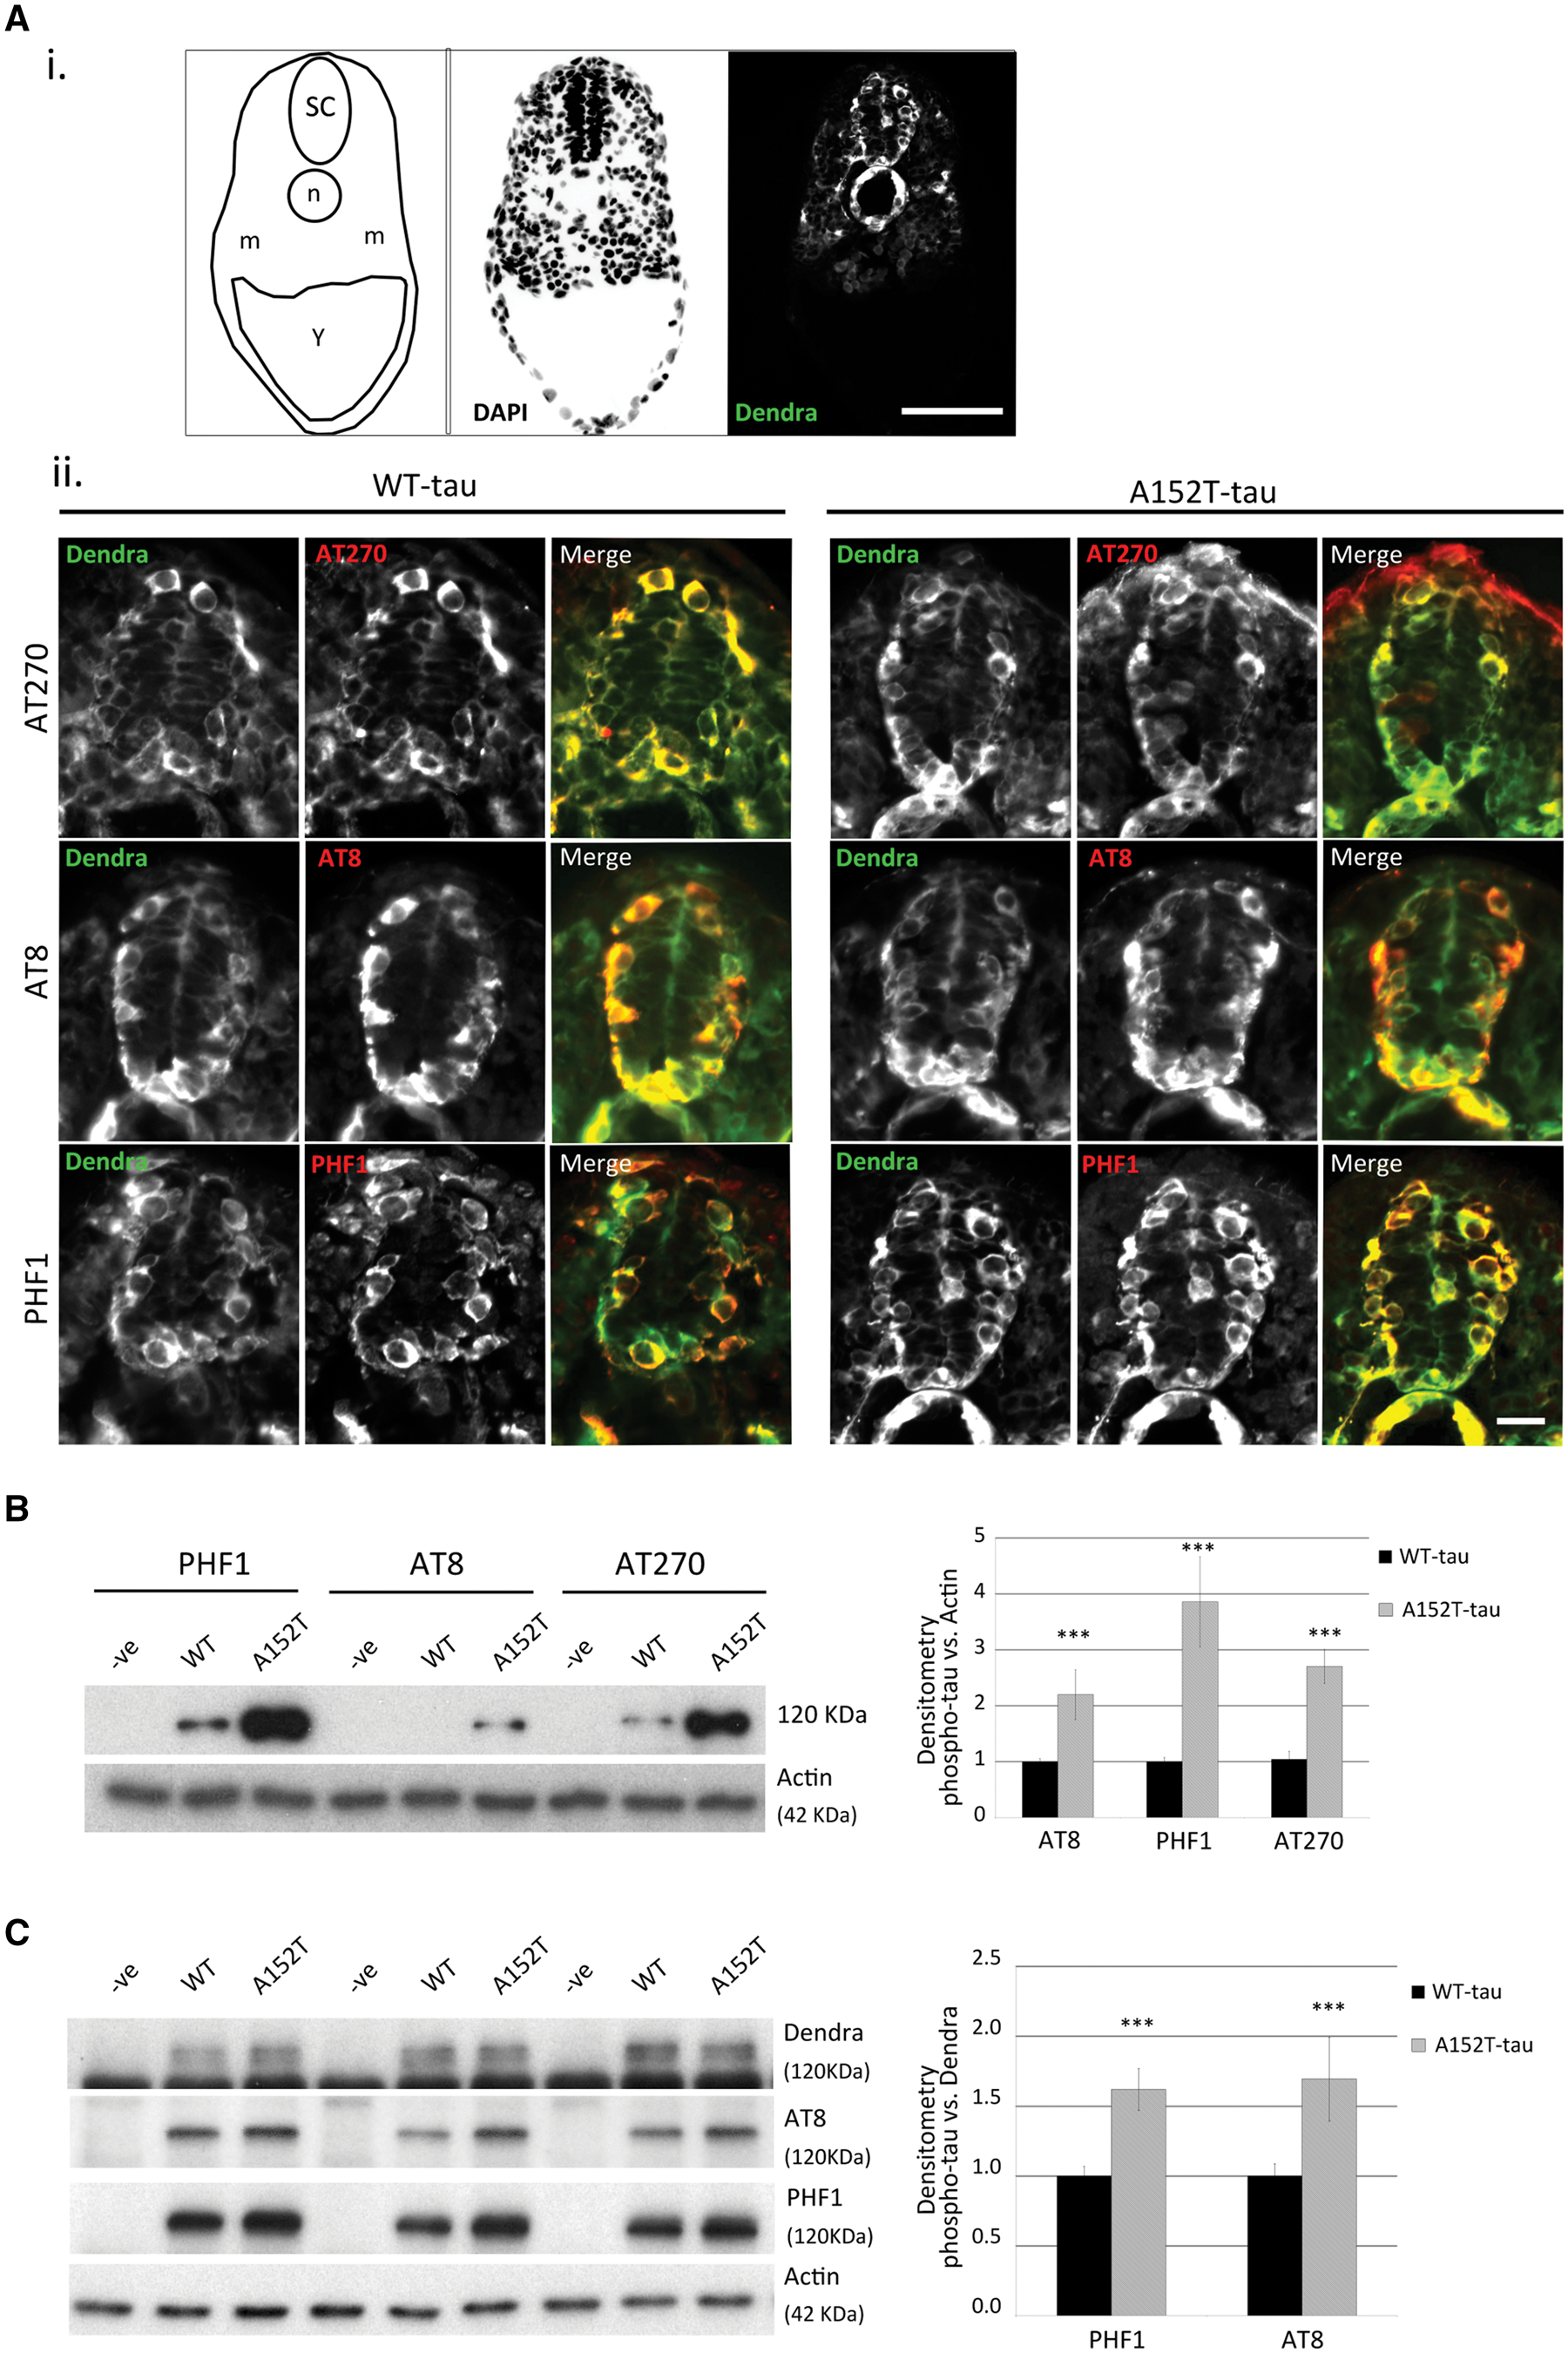
Phosphorylation state of tau in Dendra-tau transgenic zebrafish. Pathological hyperphosphorylation and conformational changes are hallmarks of tauopathies. (A) Both WT- and A152T-tau expressing larvae showed positive immunostaining for the hyperphosphorylation markers AT270 (residue Thr181), AT8 (residues Ser202/Thr205) and PHF1 (residues Ser396/Ser404) in cryosections, from 24 hpf onwards. [A(i)] Schematic overview, DAPI and Dendra images of transverse sections through the spinal cord used for phosphorylated tau detection at 24 hpf (SC = spinal cord, n = notochord, m = muscle block and Y = yolk sac). Scale bar = 50 μm. [A(ii)] Fluorescent images of Dendra-tau (green) and phospho-tau antibodies (red) show positive single neurons stained for AT270, AT8 and PHF1 within the spinal cord in both WT-tau and A152T-tau fish at 24 hpf. Scale bar = 10 μm. See Supplementary Fig. 5. (B) Western blot for phosphorylation markers AT270, AT8 and PHF1 in whole fish lysates at 3 dpf. The levels of phospho-tau were significantly increased in A152T-tau fish compared to WT-tau fish relative to the loading control, actin (mean ± SEM of 10 independent clutches; two-tailed t-test, ***P < 0.001 versus WT-tau). (C) The higher phosphorylation levels were also observed in A152T-tau fish relative to total tau (Dendra-tau) levels (mean ± SEM, n = 24 fish/group of 10 independent clutches for PHF1 and eight independent clutches for AT8; two-tailed t-test, ***P < 0.001 versus WT-tau).