
|
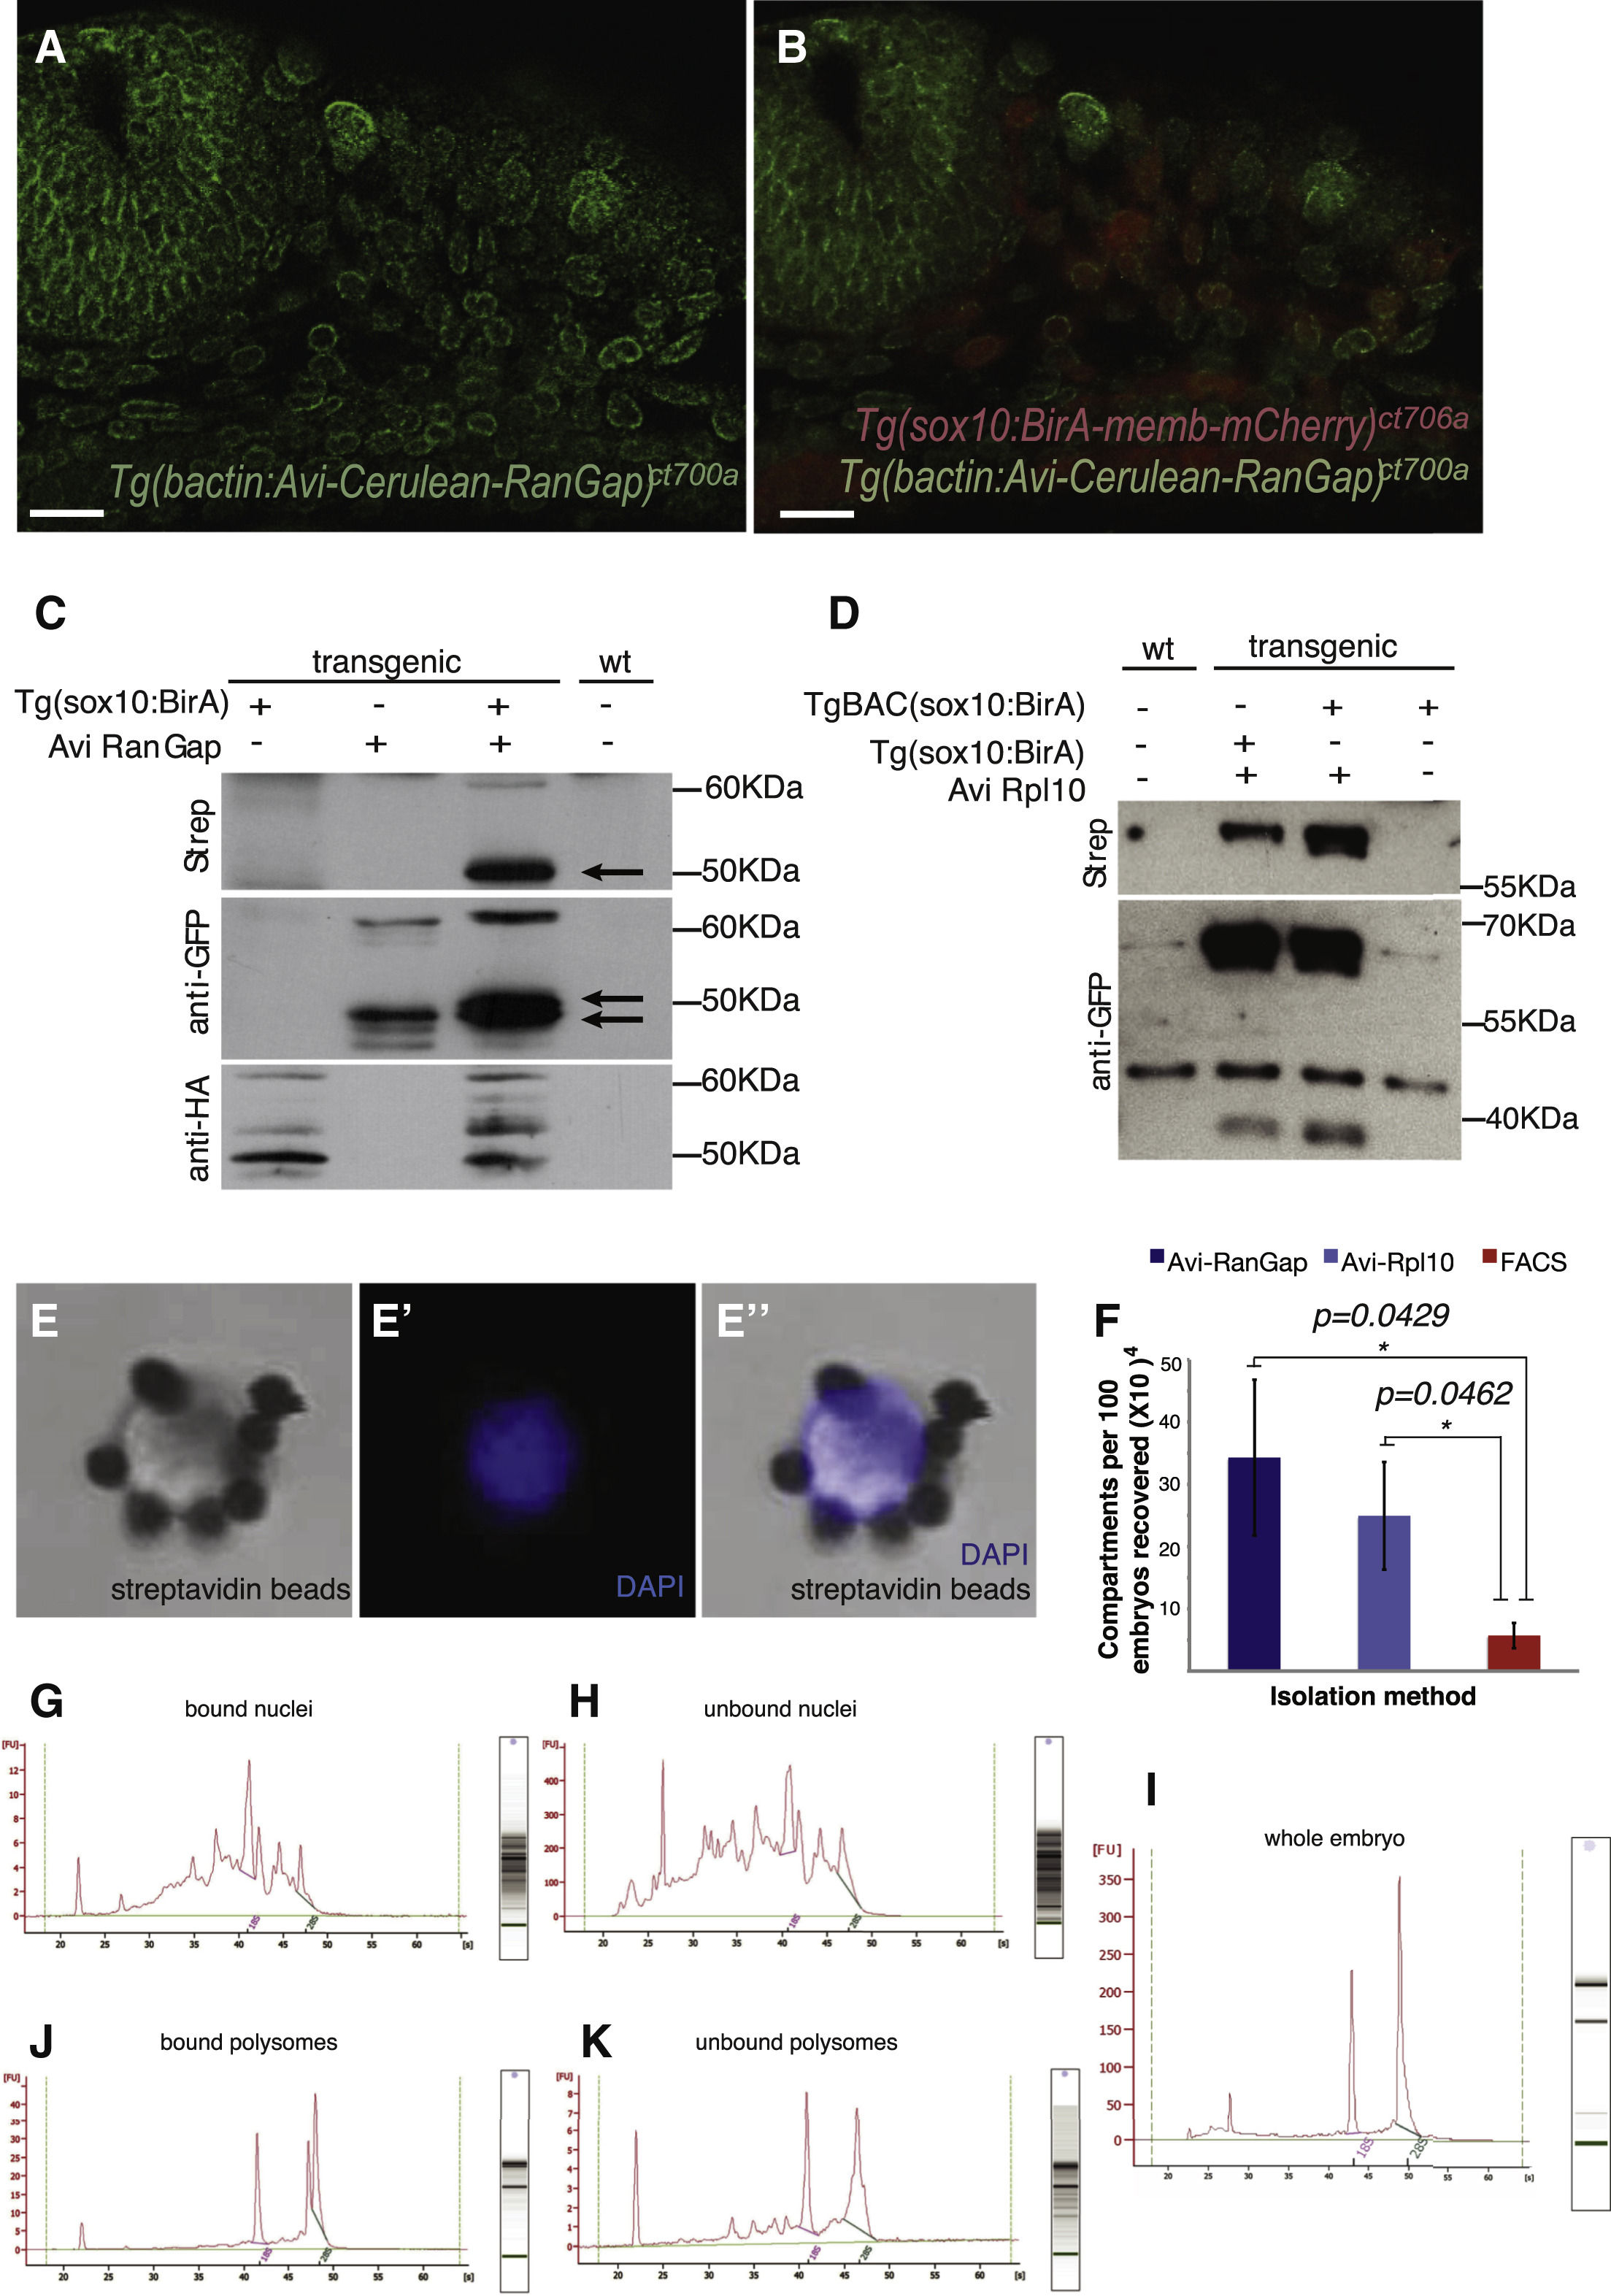
Fig. 3
Specific In Vivo Biotinylation of Avi-Tag Proteins and Purification of Subcellular Compartments
(A and B) Antibody staining for Avi-RanGap (green) and HA-BirA (red), with anti-GFP and anti-hemagglutinin (anti-HA) antibodies, respectively. In fixed samples, Avi-RanGap localize more discretely to the nuclear envelope. Anti-HA staining shows BirA (red) expressed in both nuclei and cytoplasm of cells. Scale bars, 20 μm.
(C and D) Streptavidin, anti-GFP, and anti-HA western blot of nuclear (C) and ribosome (D) extracts from BirA drivers (ncBirA or ncBirA(BAC)) and Avi-tagged (nucAvi, C) or (riboAvi, D) effector embryos. (C) Arrow points to biotinylated Avi-RanGap (C, lane 3), shifted to larger size after biotinylation when detected with anti-GFP (compare lanes 2 and 3).
(E) Bright-field image of harvested nucleus from BirA;nucAvi embryos after incubation with streptavidin Dynabeads and isolated by magnetic capture. (E′) DAPI stained of nucleus in (E). (E″) Merge of images in (E) and (E′).
(F) Quantification of total RNA yield from biotagged nuclei or ribosomes or FACS isolation protocols using ncBirA and respective Avi-tagged effectors. RNA from cellular compartments calculated per 100 embryos. Error bars represent SDs from two sequenced replicates. Significance calculated using Student’s t-test (one-tailed, two-sample equal variance).
(G–K) Representative Bioanalyzer profile of total RNA extracted from Streptavidin-bound biotagged nuclei (G), ribosomes (J), flow-through (unbound) (H and K), and whole embryo (I).