
|
Fig. 6
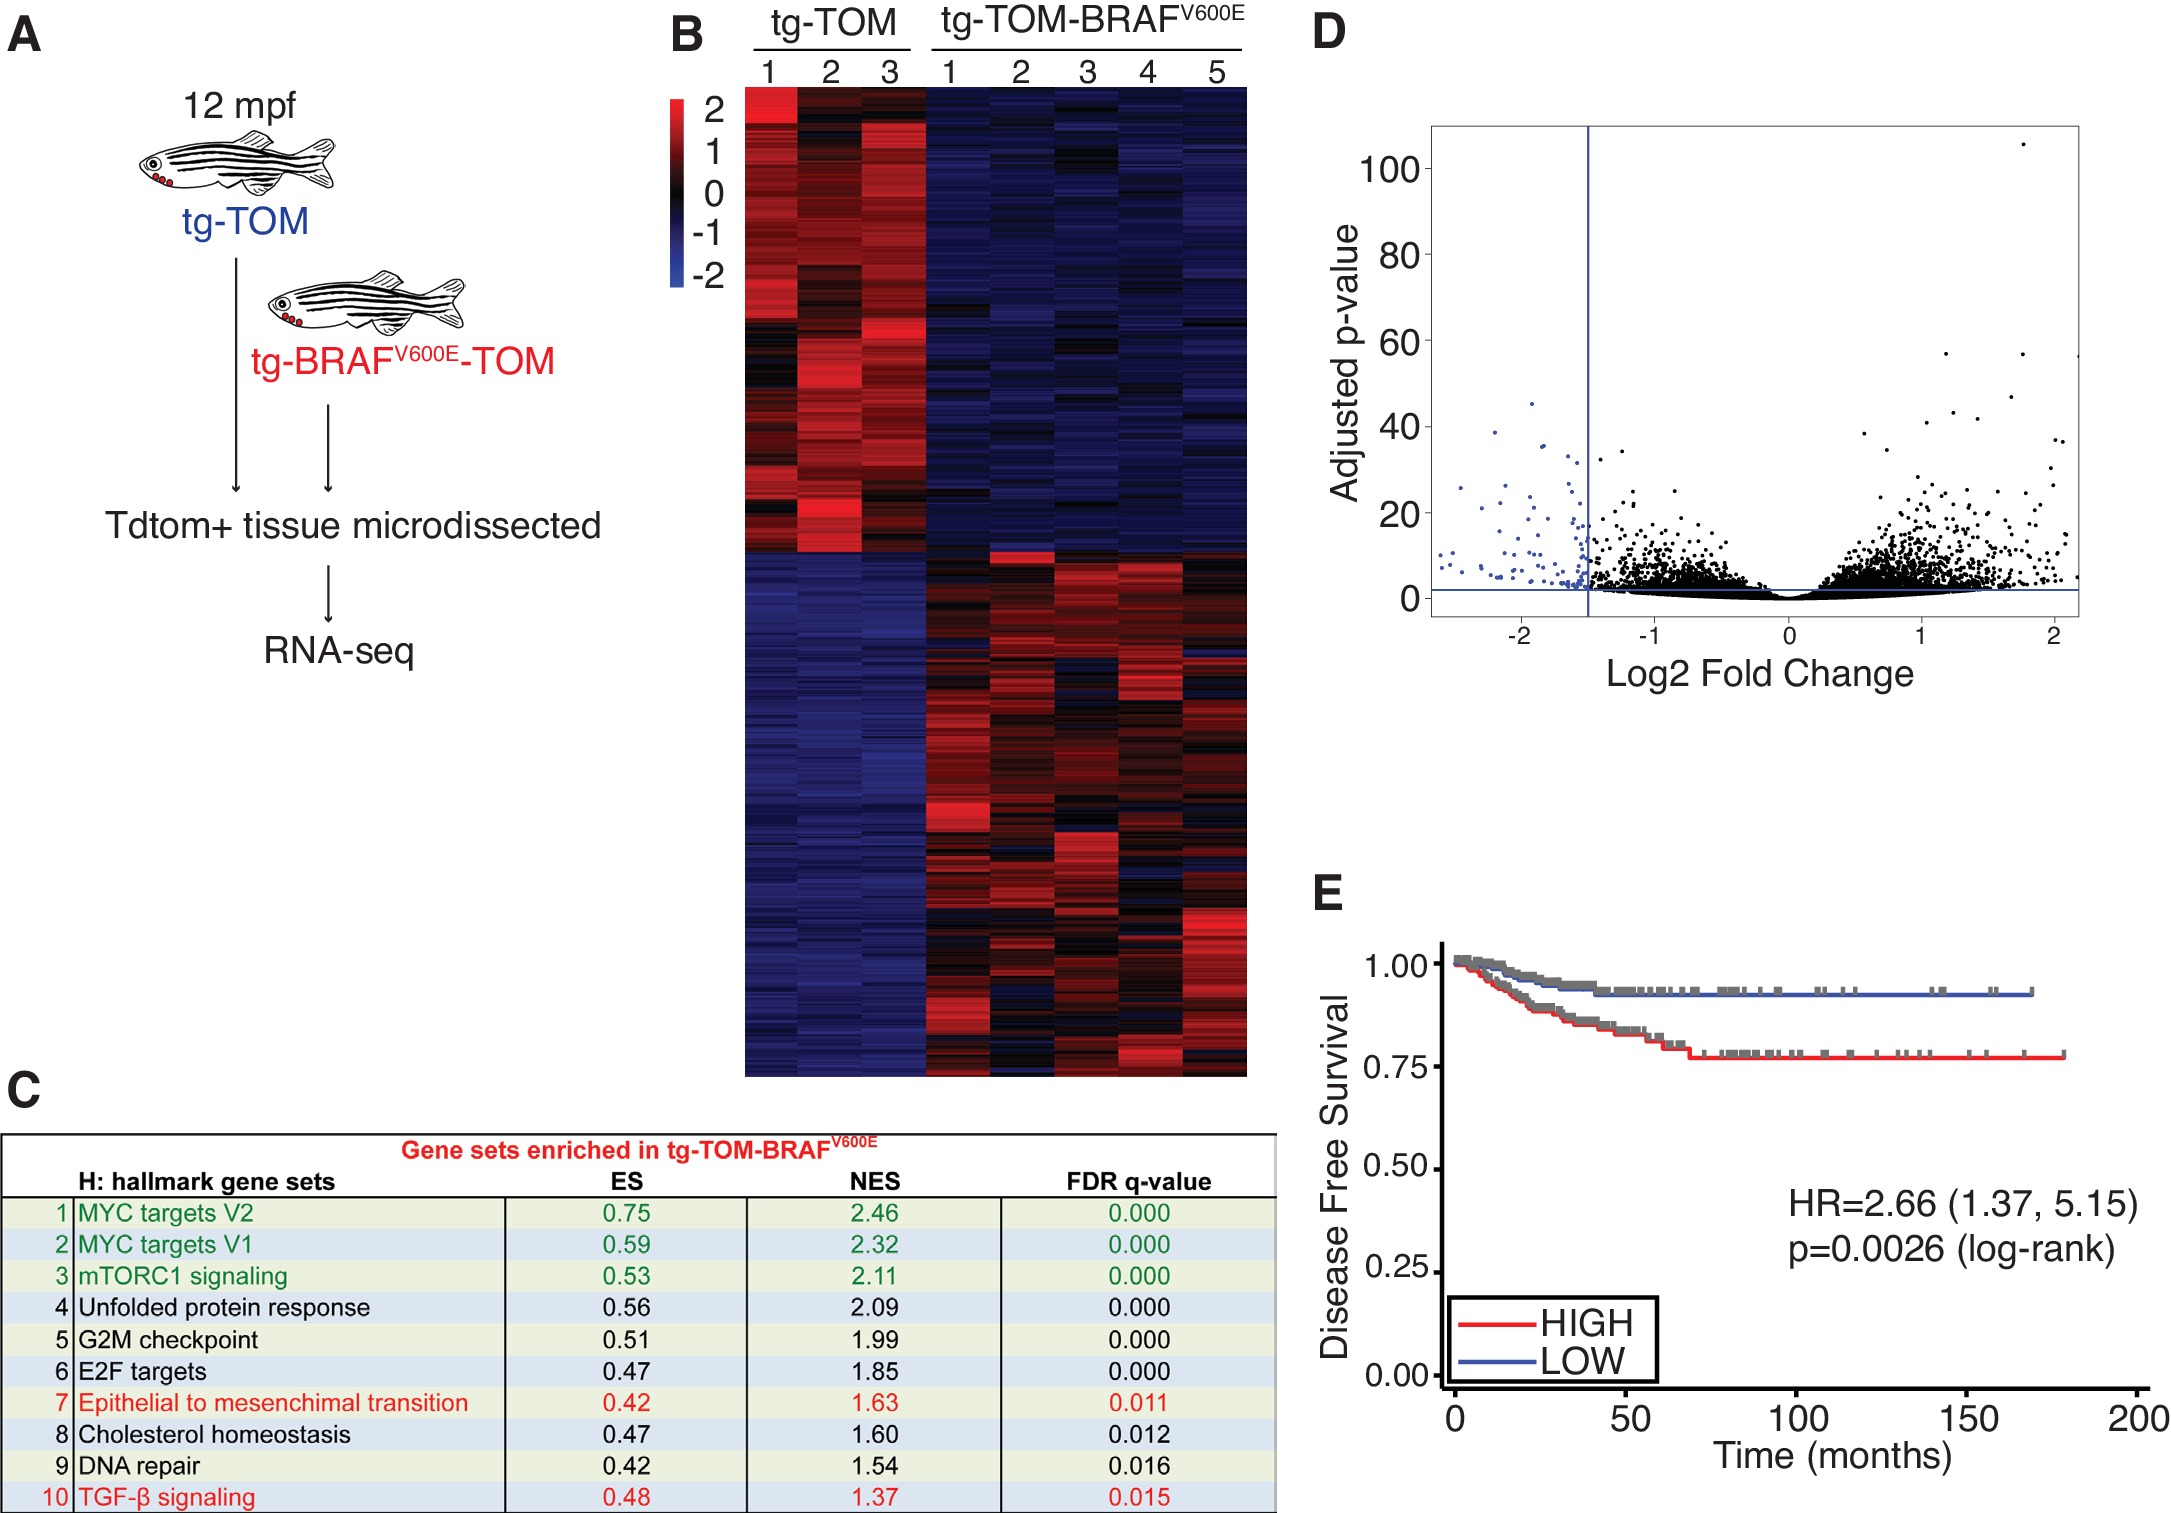
Identification of a gene expression signature from adult zebrafish thyroid carcinomas conserved in human patients with thyroid cancer.
(A) Schematic diagram of the RNA-seq workflow from adult (12mpf) thyroid tissue. (B) Heat-map depicting the top differentially expressed genes in tg-BRAFV600E-TOM thyroid tissue compared to tg-TOM thyroid tissue (Figure 6—source data 1). (C) GSEA hallmark gene sets significantly enriched in tg-BRAFV600E-TOM. (D) Volcano plot depicting differentially expressed genes in tg-BRAFV600E-TOM compared to tg-TOM thyroid tissue; a set of 58 genes (blue, FDR ≤ 1 × 10⁻⁶, FC ≤1.5, (Figure 6—source data 2) was defined as a signature of BRAFV600E expression in thyroid carcinoma. (E) Kaplan-Meier analysis of disease free survival in 496 patients with papillary thyroid cancer stratified by median BRAFV600E gene expression signature identified in (D).