
|
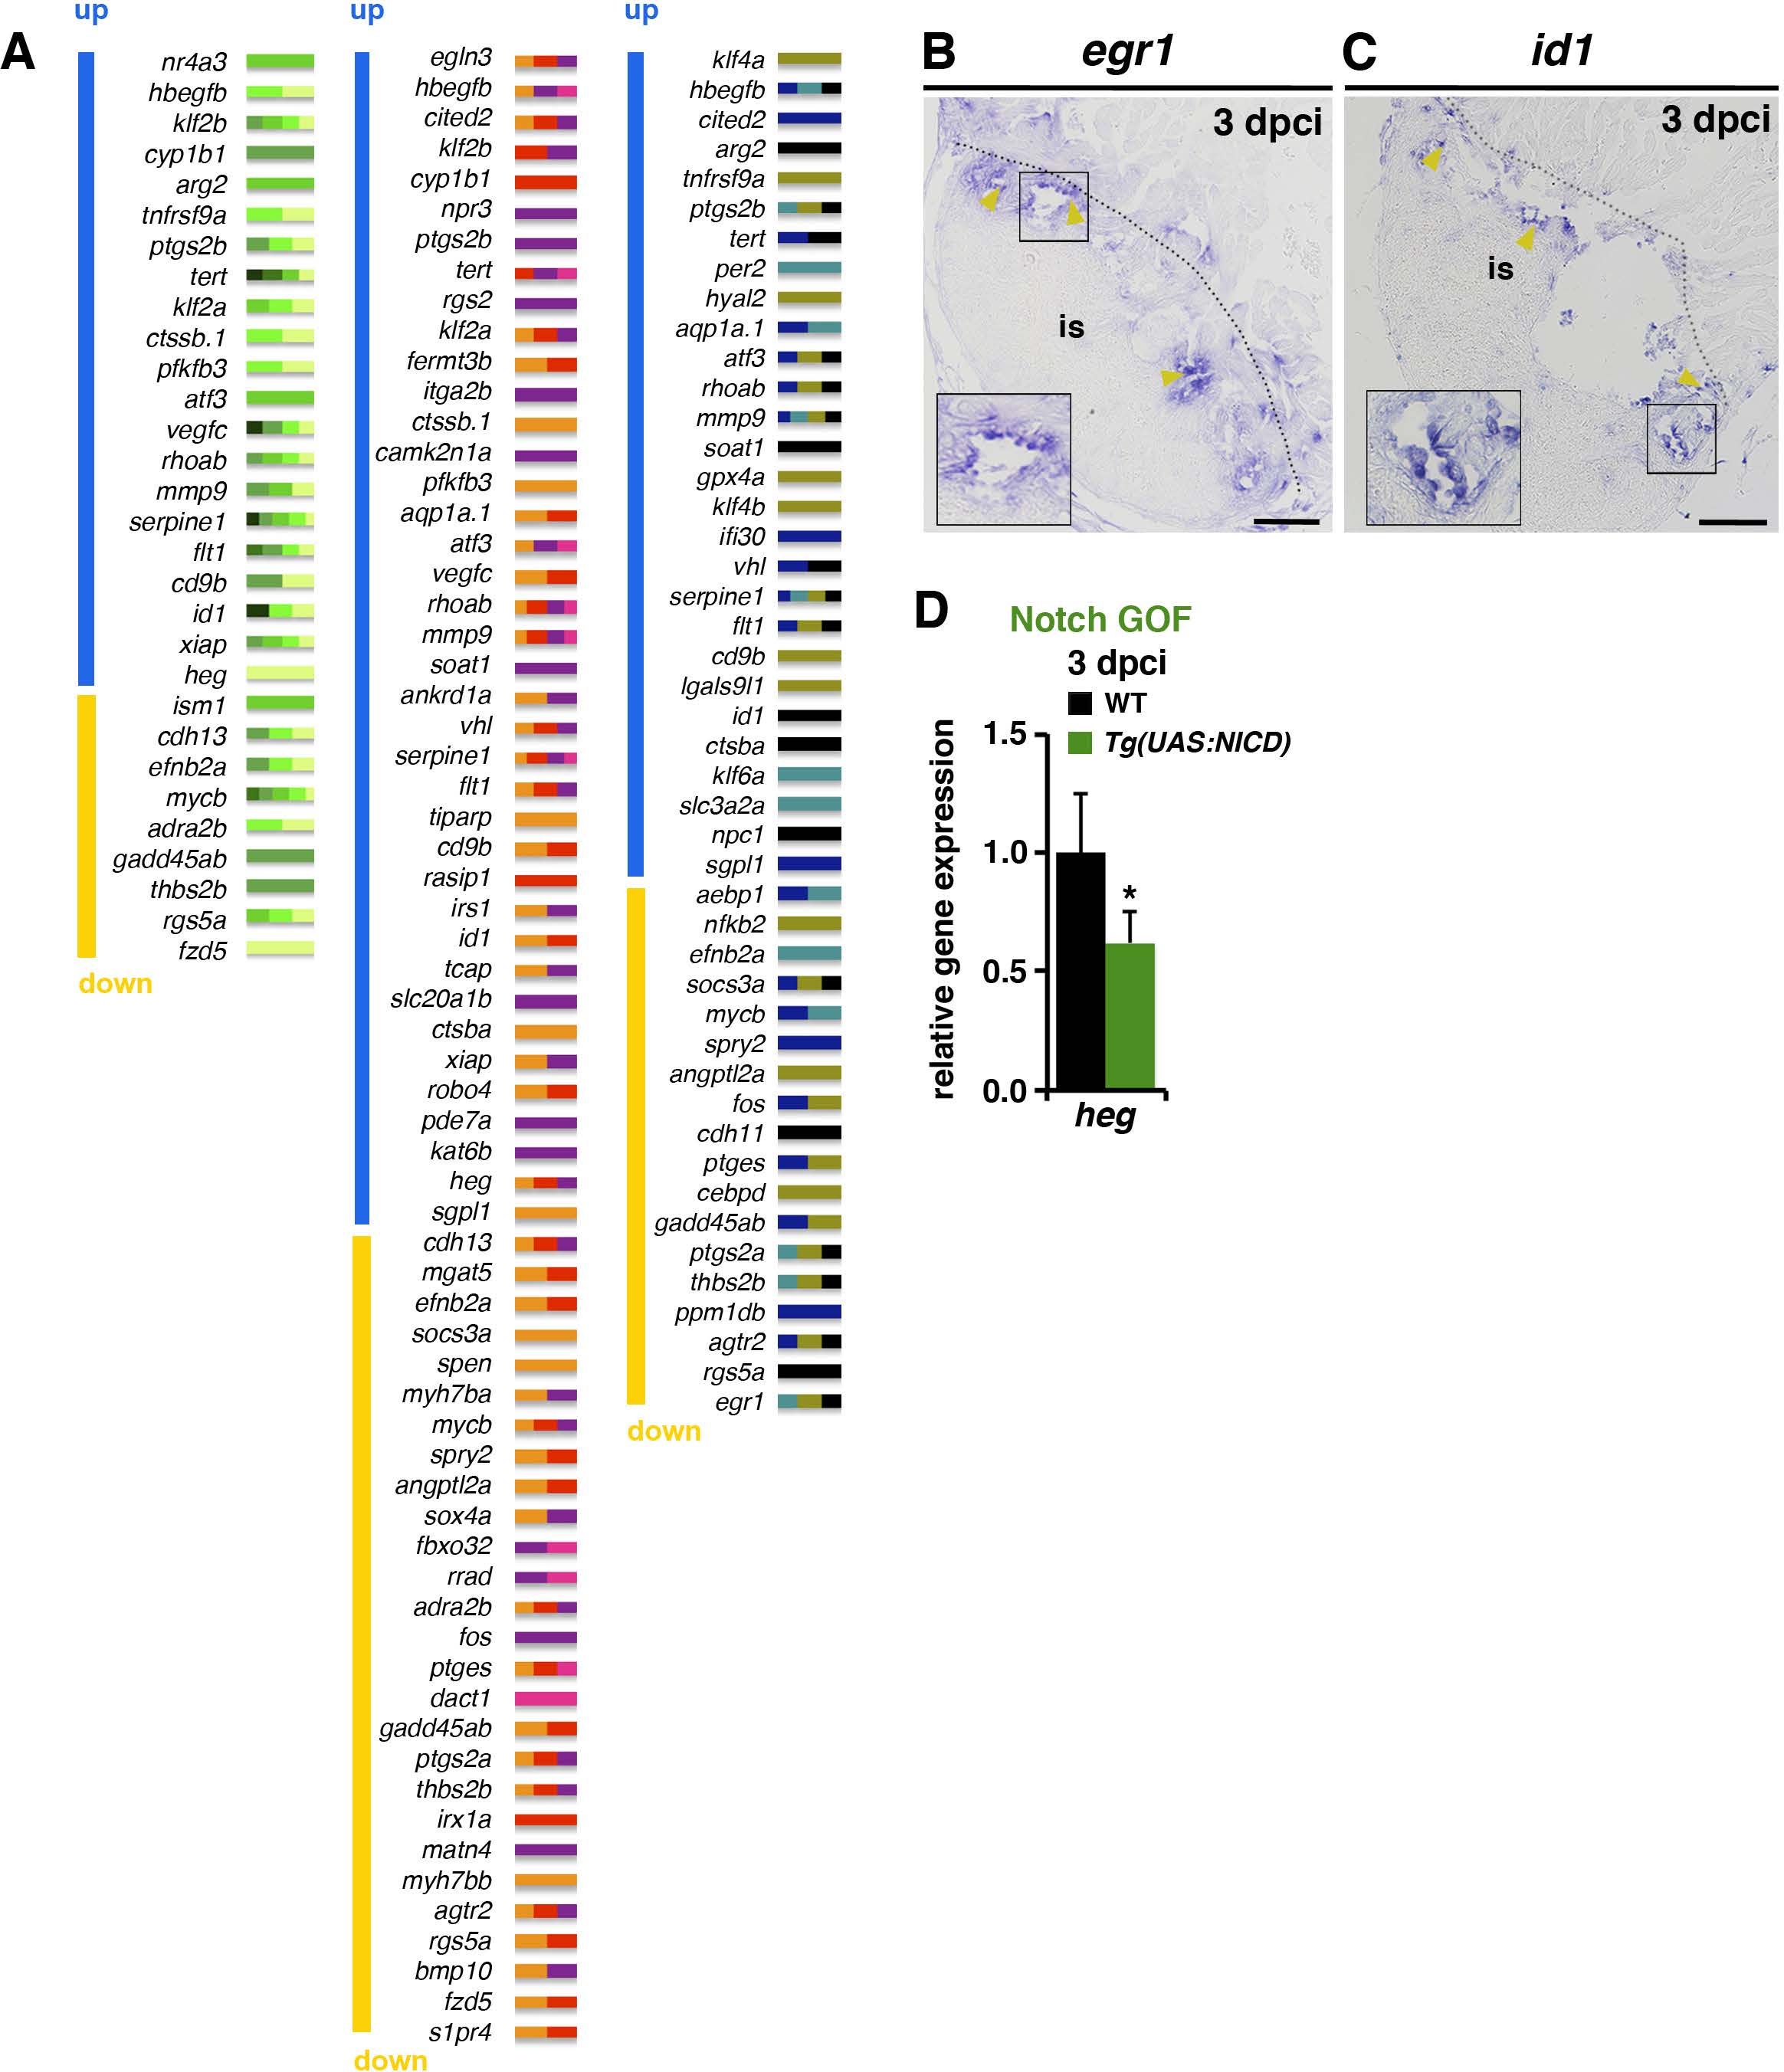
Fig. S7
Notch signalling affects endocardial/endothelial gene expression (A) Genes assigned to the three categories in (Figure 4I). Genes are ordered according to their level of differential expression (up-regulated upon RO-treatment, blue; down-regulated, yellow). The colour of small bars indicates the assigned Ingenuity categories (presented in the chart in Figure 4C). (B, C) ISH, showing egr1- and id1- expression at the inner injury border (yellow arrowheads). The boxed area is magnified in inserts. (D) qPCR analysis showing lower heg mRNA levels in Tg(UAS:NICD) transgenic injured ventricles than in control. (mean± s.d., t-test, *P<0.05). Dotted lines delineate the injury site (is). Scale bars: 100 µm.