
|
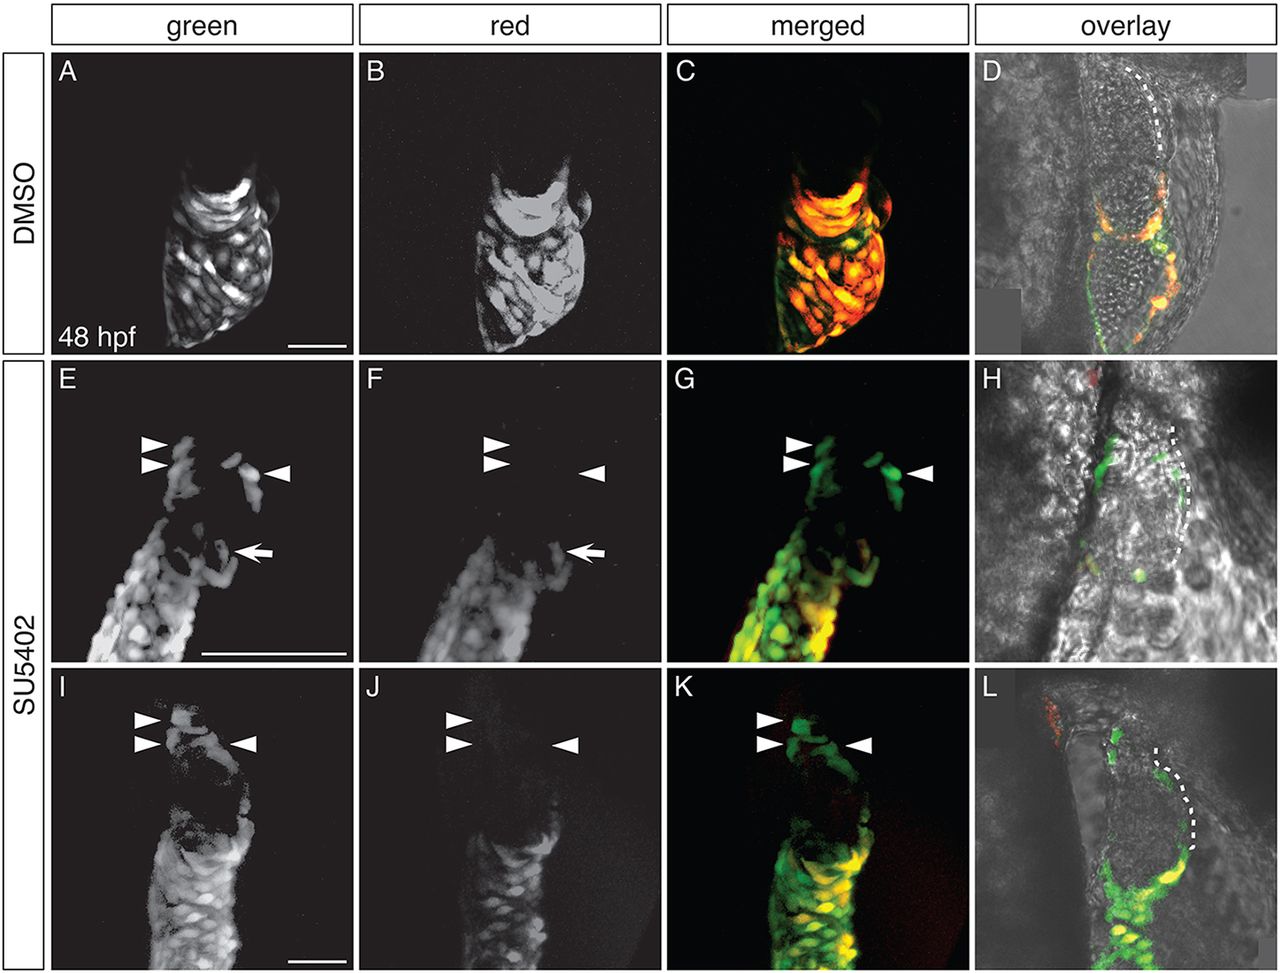
Fig. 6
Ectopic amhc-expressing cells are not derived from the atrium or AVC. (A-L) Dendra fluorescence in live DMSO-treated (A-D) and SU5402-treated (E-L) Tg(amhc:dendra) embryos at 48 hpf, following photoconversion at 26 hpf; two representative SU5402-treated embryos are shown. Images are three-dimensional reconstructions (A-C,E-G,I-K) or single optical sections (D,H,L); lateral views, anterior to the right. (D,H,L) Overlay illustrates location of Dendra+ cells within the heart; white dashes outline the ventricle. See Fig. S4 for additional information regarding experimental design. (A-D) In DMSO-treated controls, Dendra is found only in the atrium and AVC. Both green and red forms of Dendra are visible, as illustrated in single channel and merged views (n=10). (E-L) SU5402-treated embryos exhibit Dendra+ cells in the ventricle, in distinct clusters at the arterial pole and in the inner curvature (arrowheads). Cells at the arterial pole and inner curvature fluoresce green, but not red (arrowheads; n=15). Dendra+ cells are also found in and near the AVC (arrows), as seen in controls (A-D), reflecting the wild-type expression of amhc in this area (Foglia et al., 2016). Scale bars: 50 μm (A,I); 100 μm (E).