
|
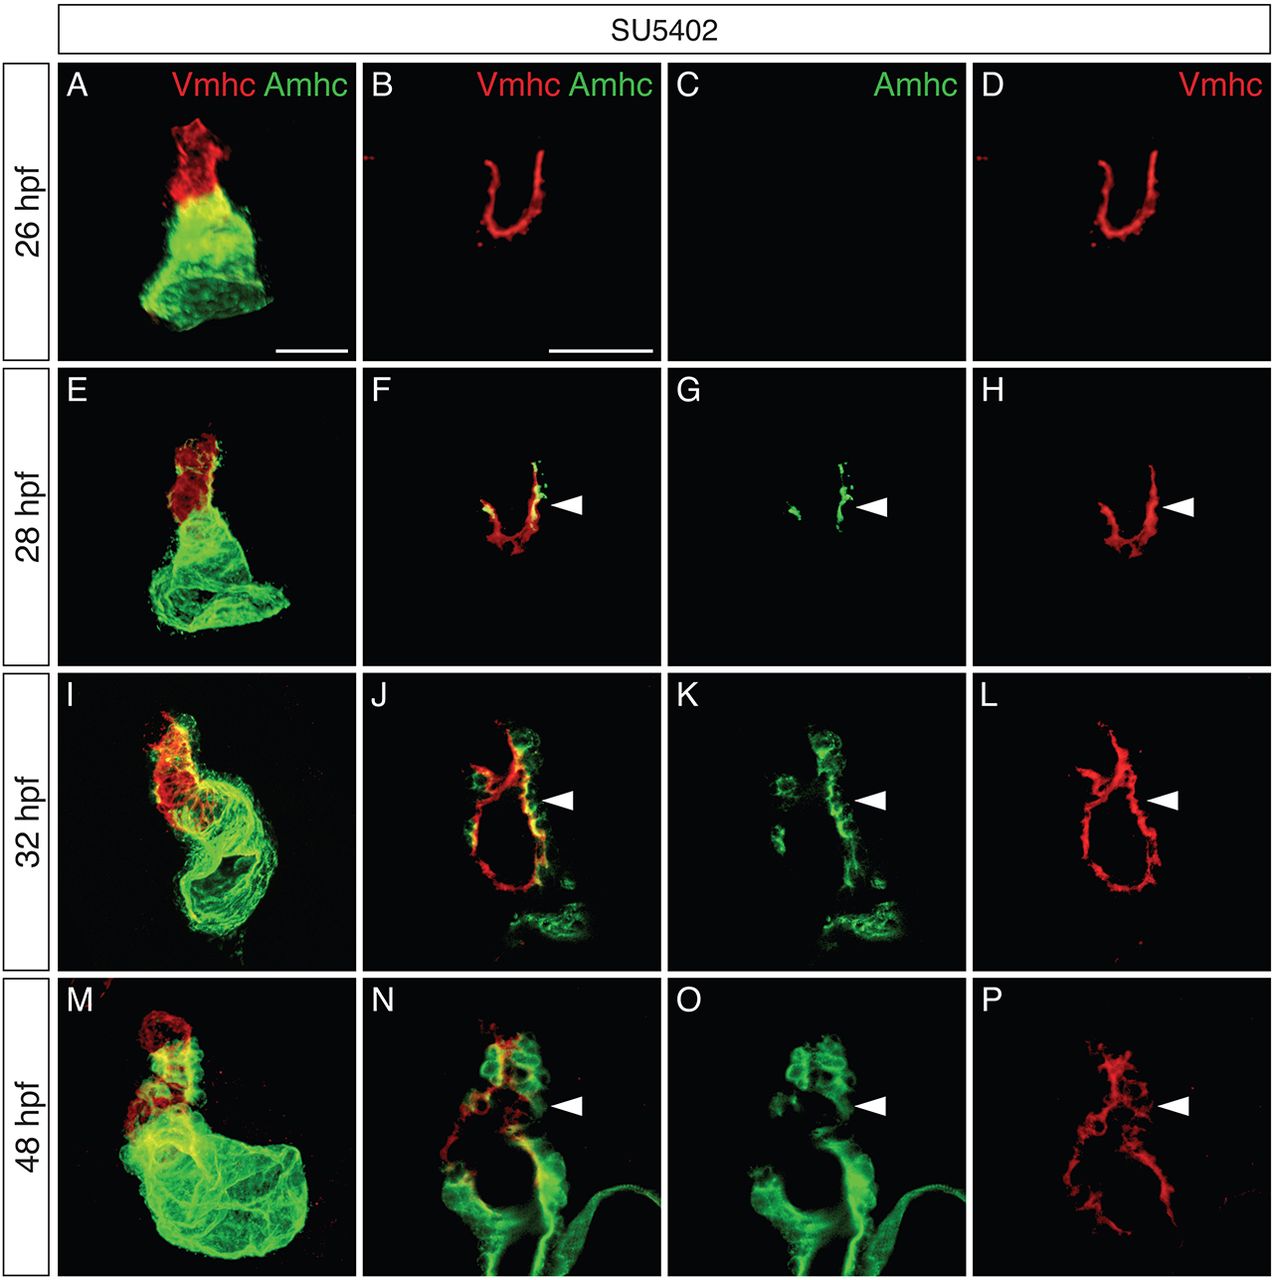
Fig. 5
Increased colocalization of Vmhc and Amhc in the ventricle when FGF signaling is inhibited. (A-P) Immunofluorescence showing Vmhc (red) and Amhc (green) localization in embryos treated with SU5402 from 18 hpf. Lateral views are three-dimensional reconstructions (A,E,I,M) or magnified single optical sections, showing both channels (B,F,J,N), green only (C,G,K,O) or red only (D,H,L,P). See Fig. S3 for DMSO-treated control embryos. (A-D) At 26 hpf, the SU5402-treated ventricle contains only Vmhc (n=10). (E-H) By 28 hpf, Amhc is evident within some Vmhc+ cells, particularly along the inner curvature (arrowheads; n=9). We presume that these cells are early-differentiating cardiomyocytes, as late-differentiating cardiomyocytes normally contribute to the heart after 30 hpf (Lazic and Scott, 2011). (I-L) By 32 hpf, increasing numbers of Amhc+Vmhc+ cells are visible in the ventricle (arrowheads; n=11). (M-P) By 48 hpf, higher levels of Amhc accumulate in ectopic cells (arrowheads), in concert with diminishing levels of Vmhc (n=9). Scale bars: 50 μm.