
|
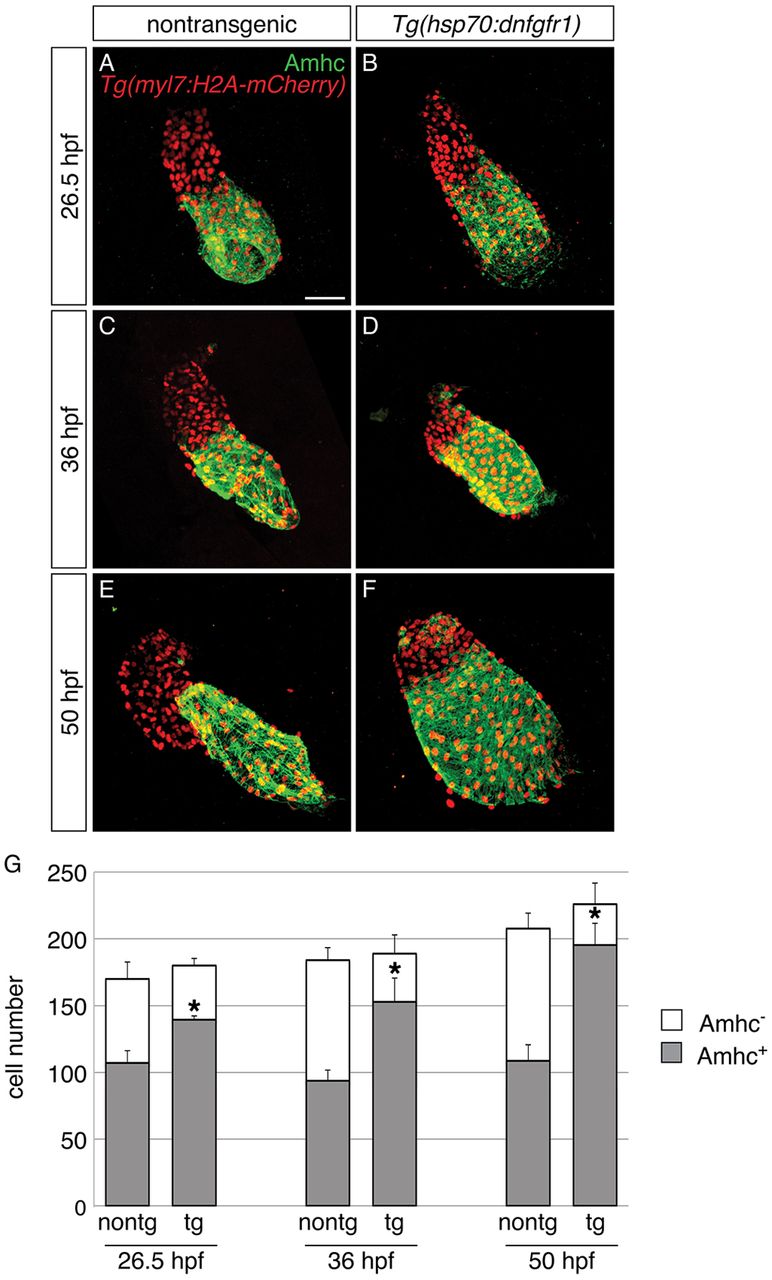
Fig. 3
Progressive accumulation of Amhc+ cells and decrease in Amhc− cells in embryos with reduced FGF signaling. (A-F) Immunofluorescence for Amhc (green) and mCherry (red) allows counting of Amhc+ and Amhc− cardiomyocytes in nontransgenic (A,C,E) and Tg(hsp70:dnfgfr1) embryos (B,D,F) carrying Tg(myl7:H2A-mCherry). Images depict hearts flattened to facilitate visualization of individual myocardial nuclei at 26.5 (A,B), 36 (C,D) and 50 hpf (E,F). Heat-induced expression of dnfgfr1 at 18 hpf results in a gradual shift in chamber proportions that leads to an enlarged atrium and a reduced ventricle. In addition, there is a visible increase in the presence of Amhc+ cells within the ventricle over time. (G) Numbers of Amhc+ (gray) and Amhc− (white) cardiomyocytes, as well as the total number of cardiomyocytes (mean+s.d.); asterisks indicate statistically significant differences from nontransgenic (P<0.0001). Cell counts reveal a gradual increase in numbers of Amhc+ cells and a corresponding decrease in numbers of Amhc− cells in hearts of Tg(hsp70:dnfgfr1) embryos [26.5 hpf: n=8 for nontransgenic, n=6 for Tg(hsp70:dnfgfr1); 36 hpf: n=11 for nontransgenic, n=9 for Tg(hsp70:dnfgfr1); 50 hpf: n=8 for nontransgenic, n=12 for Tg(hsp70:dnfgfr1)]. See Table S1 for the number of ectopic Amhc+ cells in a subset of these embryos. Scale bar: 50 μm.