
|
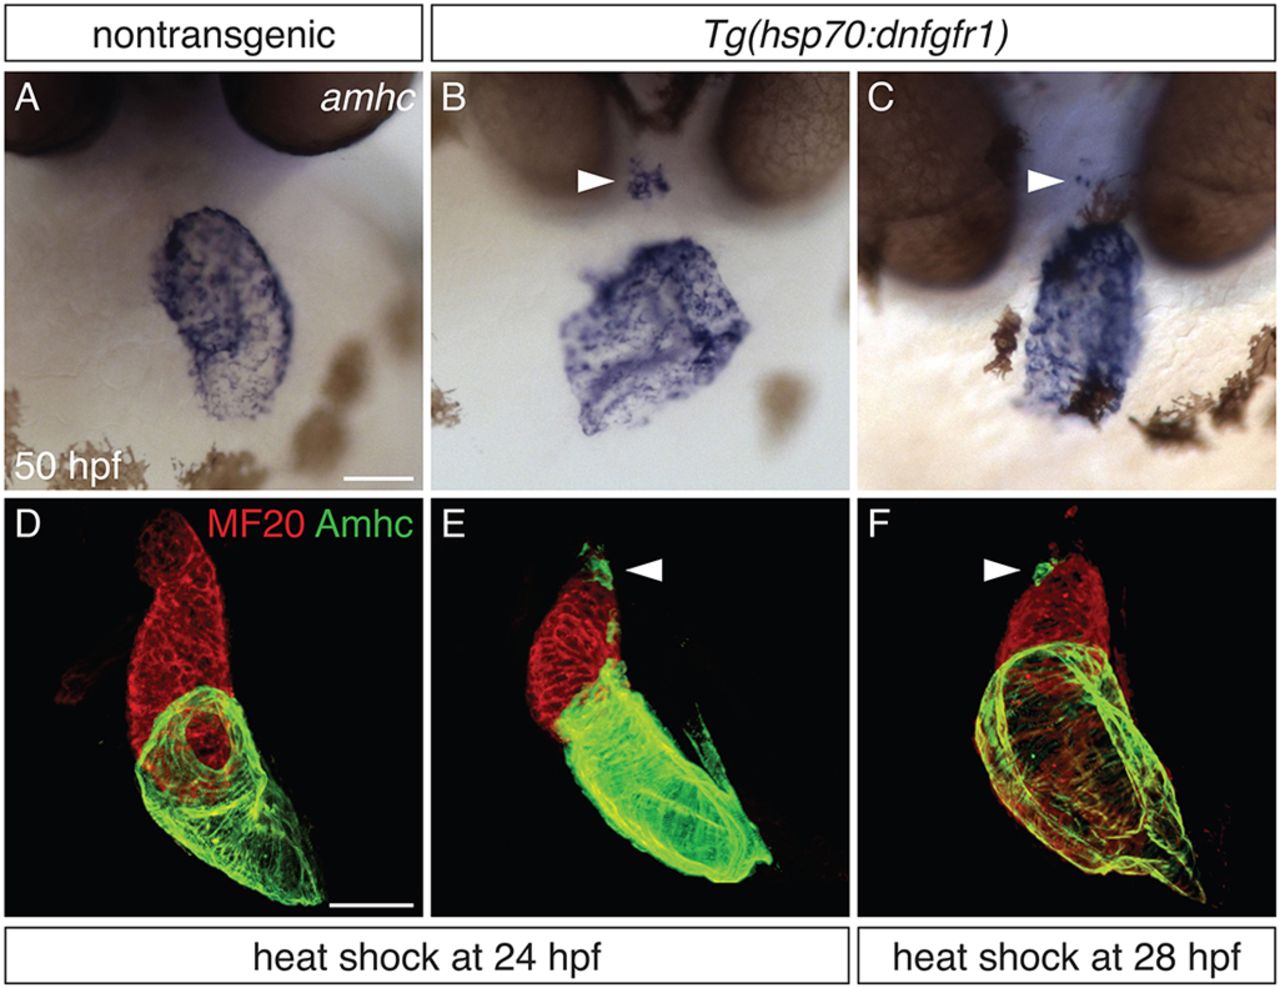
Fig. 2
Defining a time interval during which FGF signaling prevents ectopic amhc expression. (A-C) In situ hybridization depicts amhc expression in frontal views of nontransgenic (A) and Tg(hsp70:dnfgfr1) (B,C) embryos at 50 hpf. Heat shock at 24 hpf (A,B) induces ectopic amhc-expressing cells in nearly all Tg(hsp70:dnfgfr1) embryos (B; n=22/24), whereas ectopic cells are induced less frequently with heat shock at 28 hpf (C; n=6/36). Heat shock at 18 hpf gives rise to approximately 20-30 ectopic amhc-expressing cells (Fig. 1C), heat shock at 24 hpf induces approximately five to ten ectopic amhc-expressing cells (B, arrowhead), and approximately two to three ectopic cells are produced with heat shock at 28 hpf (C, arrowhead). (D-F) Three-dimensional reconstructions of immunofluorescence, as in Fig. 1E-H, of nontransgenic (D) and Tg(hsp70:dnfgfr1) (E,F) embryos. Whereas Tg(hsp70:dnfgfr1) embryos heat shocked at 18 hpf (Fig. 1G) typically display ectopic amhc-expressing cells in the ventricular inner curvature and at the arterial pole, Tg(hsp70:dnfgfr1) embryos heat shocked at 24 (E) and 28 hpf (F) primarily exhibit ectopic cells at the arterial pole (arrowheads) [n=15 for nontransgenic, n=10 per condition for Tg(hsp70:dnfgfr1)]. Scale bars: 50 μm.