
|
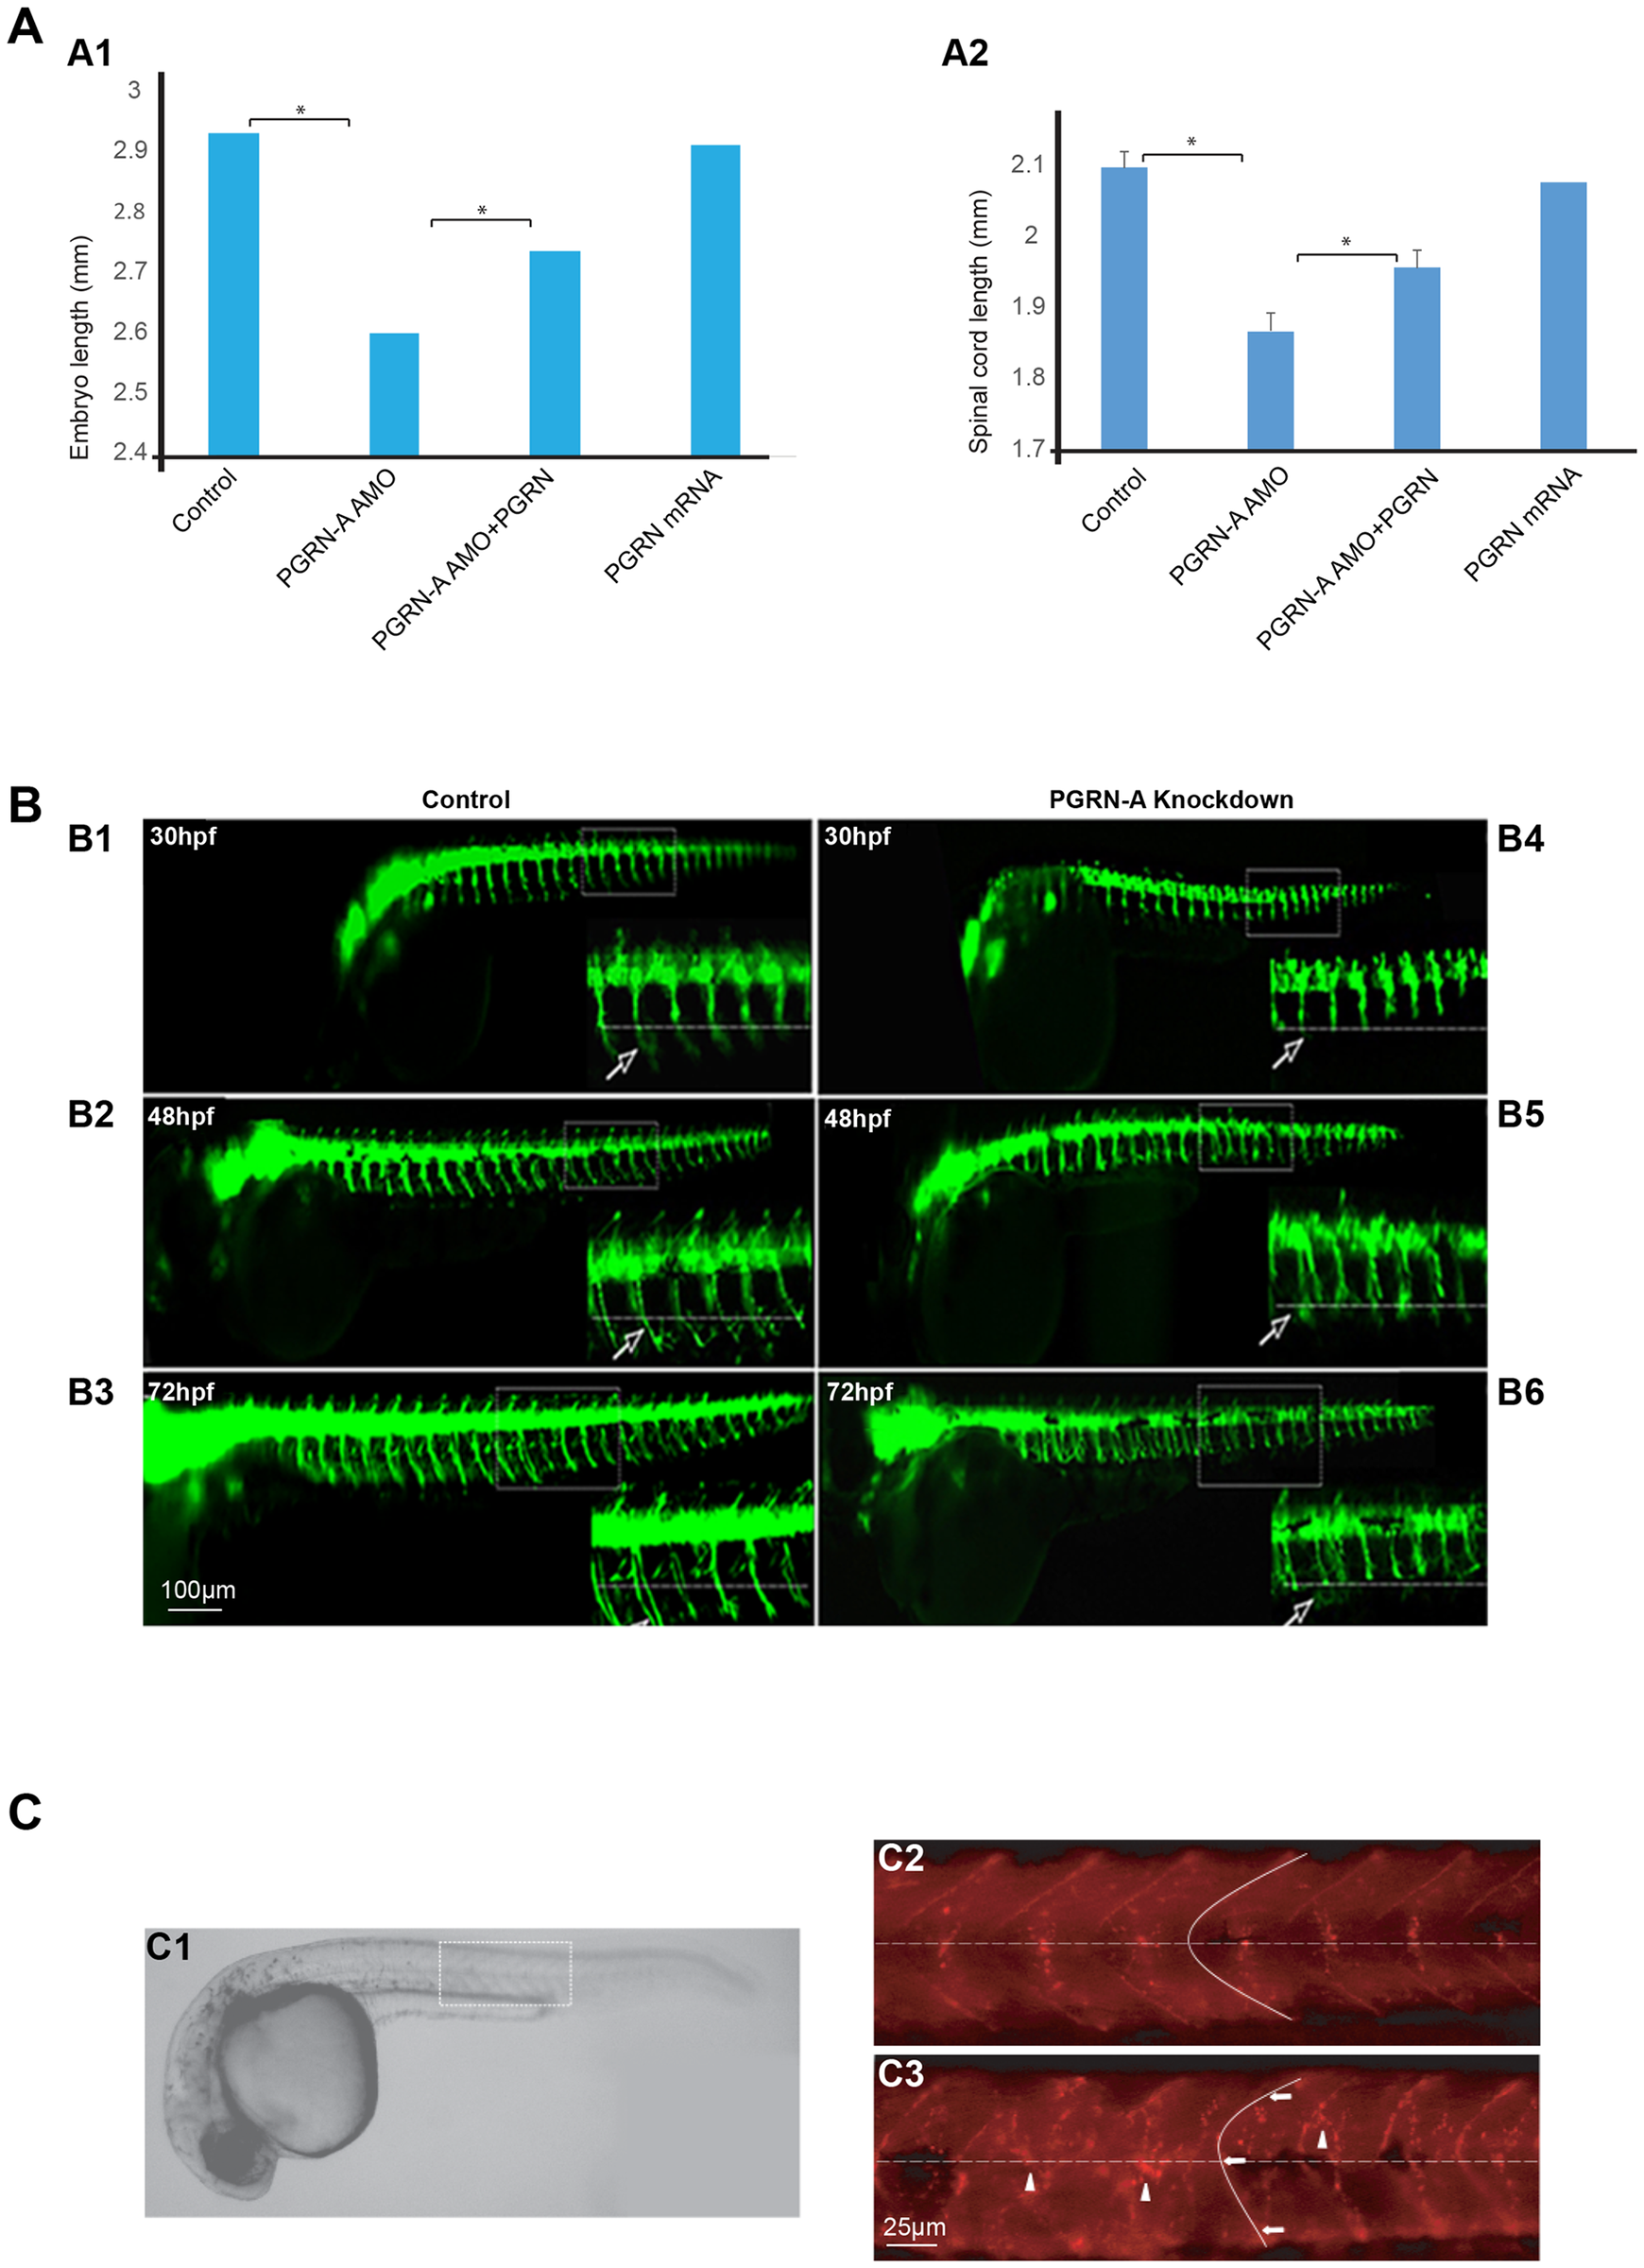
Fig. 2
Neuromuscular developmental characteristics of zfPGRN-A knockdown embryos.
Fig 2A. Embryos injected with zfPGRN-A AMO displayed reduced overall body length (A1) and a corresponding reduction in the length of the spinal cord (A2). Co-injection of hPGRN mRNA with zfPGRN-A AMO (zfPGRN-A AMO+hPGRN) significantly reversed these phenotypes while hPGRN mRNA alone had no effect on overall body length or the length of the spinal cord (Fig 2A). The spinal cord length or embryo length were measured by tracing spinal cord or embryo using imageJ. Fig 2B zfPGRN-A knockdown resulted in CaP MNss stalling at the horizontal myoseptum as shown by the failure of axonal outgrowth to extend beyond the horizontal myoseptum for up to 72hpf Controls demonstrate normal outgrowth (B1, B2, B3). In the embryos expressing a reduced level of zfPGRN-A CaP MNs are stalled at HM (B4, B5, B6). The panels show lateral views (anterior to the left; dorsal to the top) of embryos obtained from the HB9:GFP transgenic fish in which MNs express HB9 promoter-driven GFP at 30hpf (B1, B4) 48hpf (B2, B5) and 72hpf (B3, B6). Images were captured at 5X magnification and the hatched box was further subjected to 4–5 X Zoom. Dashed lines represent a horizontal myoseptum (HM). Observed phenotypes were normal MN development (Control 30hpf (B1), 48hpf (B2), 72hpf (B3); white arrows) and truncated or shorter axons (zfPGRN-A AMO 30hpf (B4), 48hpf (B5), 72hpf (B6); white arrows). Fig 2C PGRN PGRN deficient embryos displayed aberrant somatic boundaries as well as disorganized and mislocated AChR aggregates in the neuromuscular junctions of the somatic muscles. Panel C1 shows a lateral view of the wild type 27hpf embryo. The boxed area is representative of the areas shown in panels C2 and C3 and dashed lines indicate the horizontal myoseptum. AChR clusters were visualized by alpha-Bungarotoxin staining of control embryos at 27hpf (C2)) and in embryos injected with PGRN-A MO (C3). PGRN-A knockdown embryos show aberrant somite boundaries compared with wild type embryos as indicated by tracing of somite boundaries. PGRN-A knockdown embryos also displayed disorganized and mislocated AchR clusters AChR aggregates compared with wild type embryos. Arrows indicate somite boundaries. Arrowheads denote AChR aggregates.