
|
Fig. 4 S1
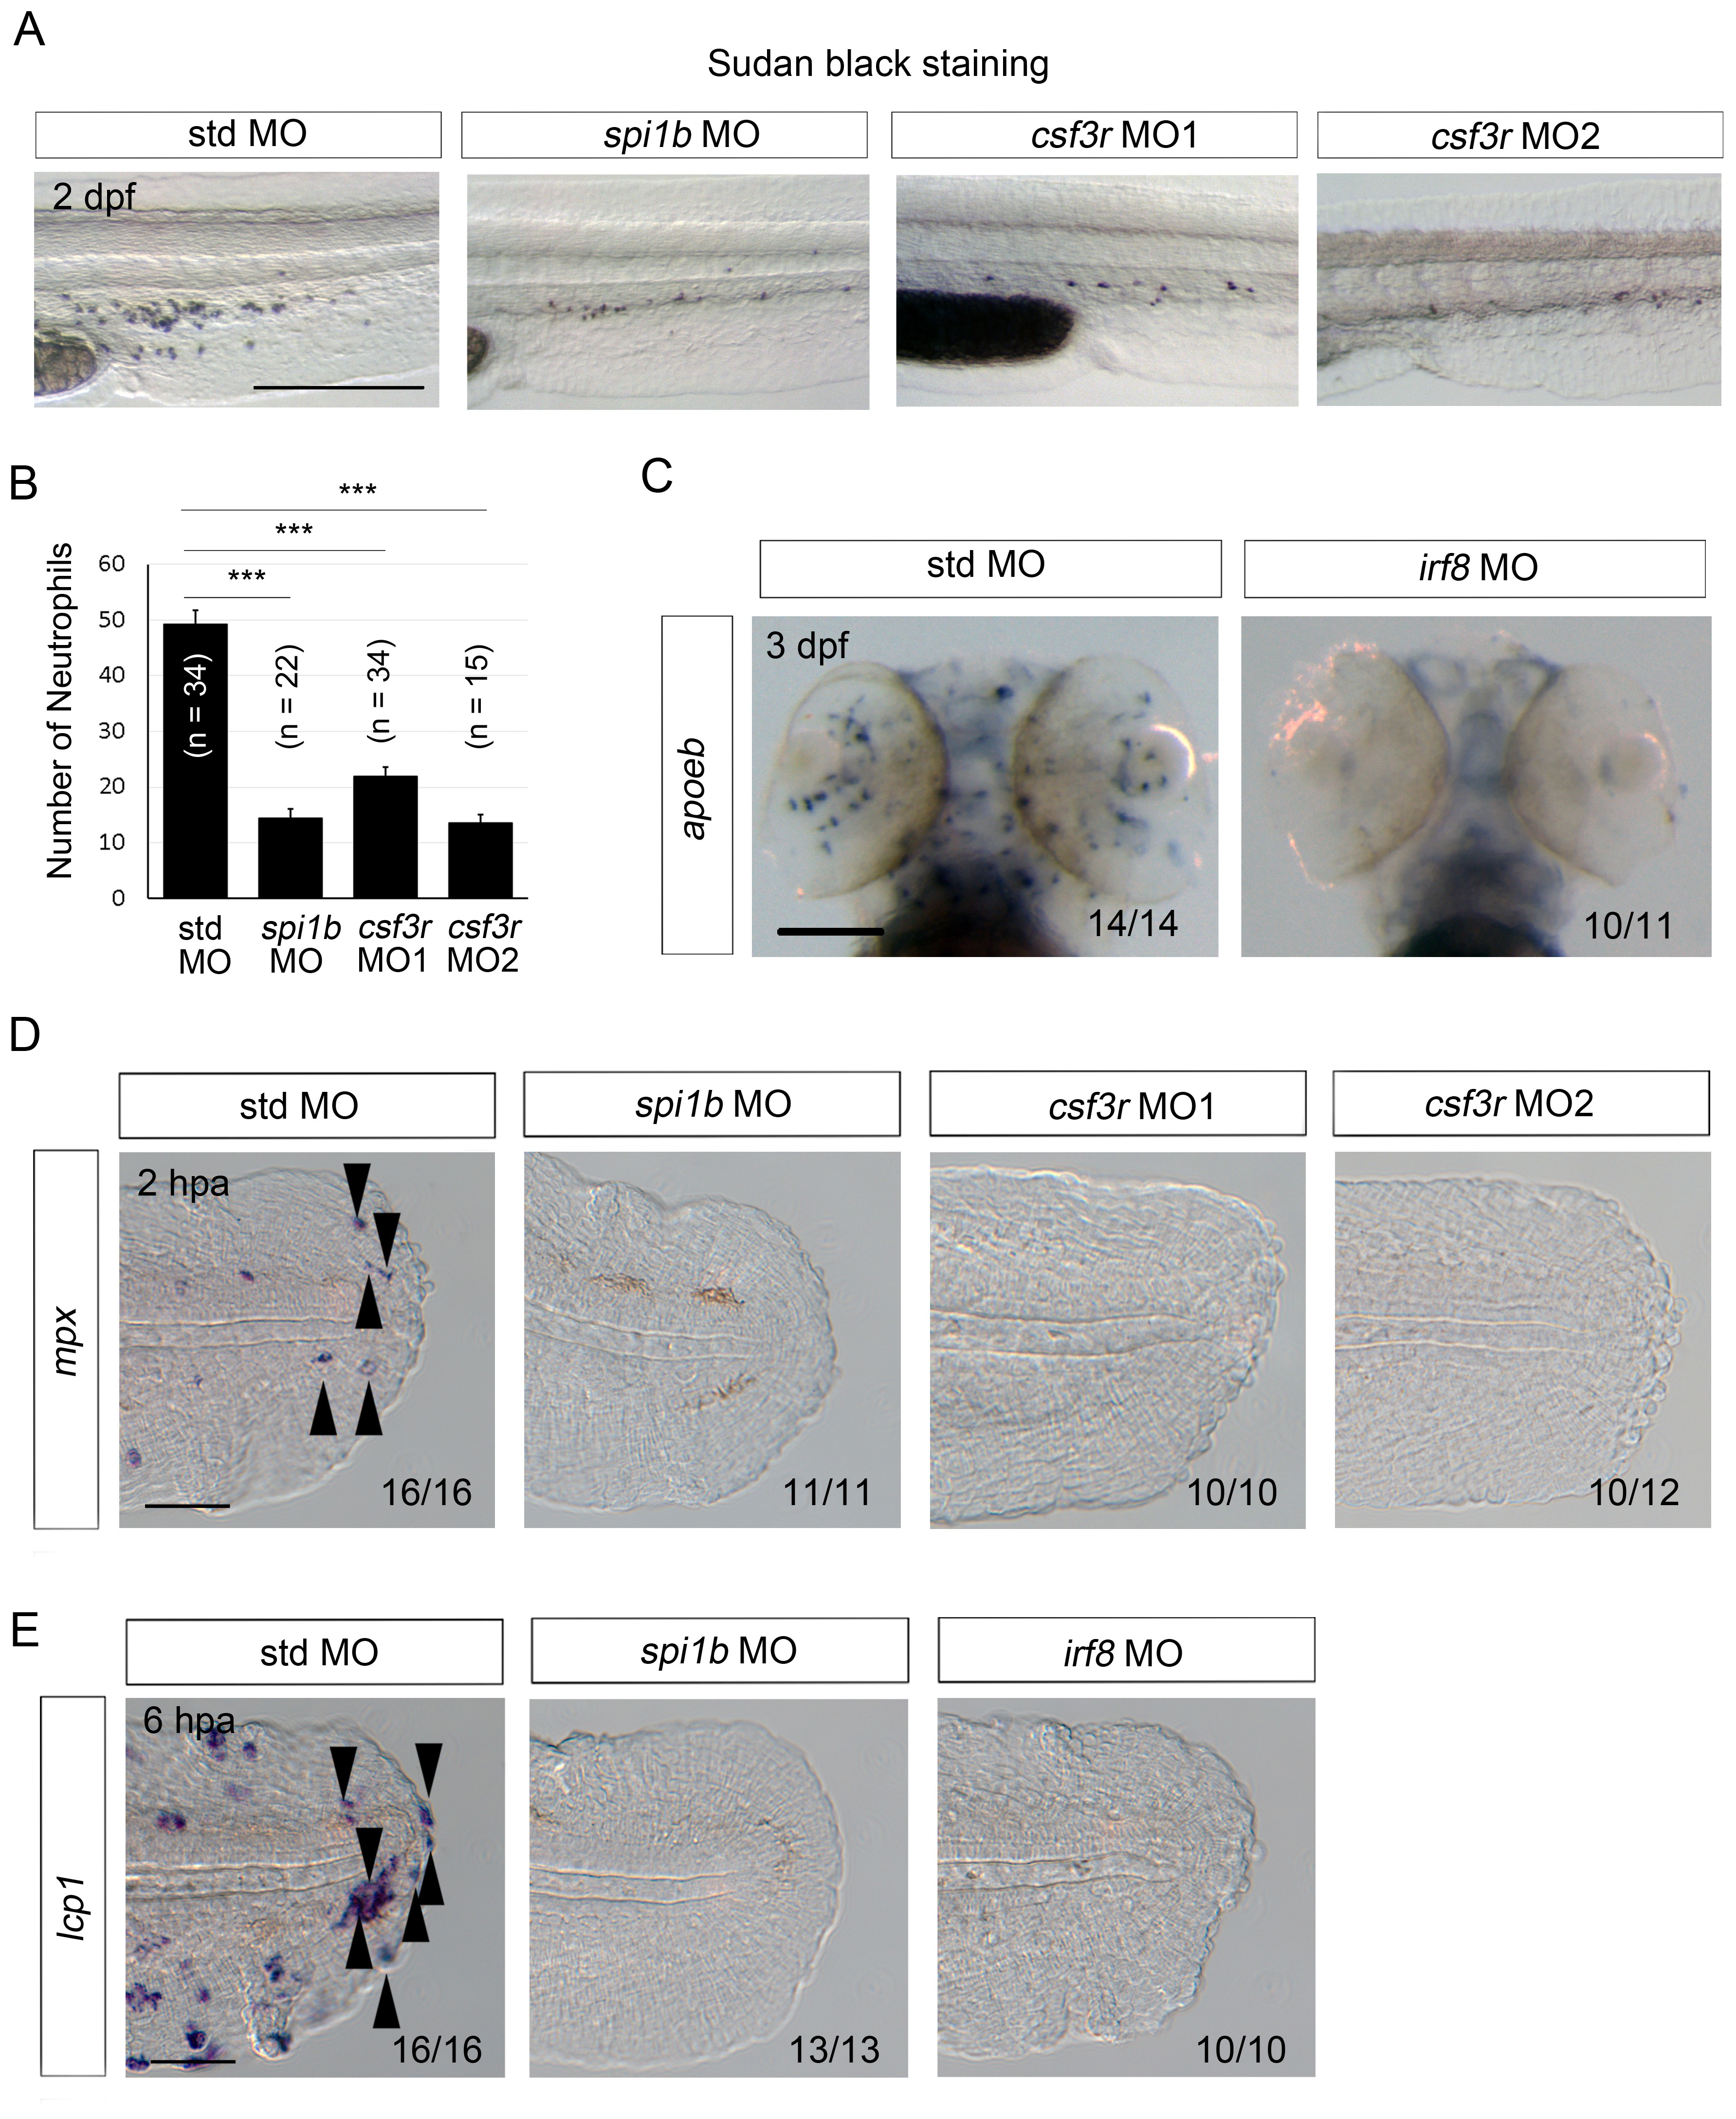
Efficacy of MO-mediated macrophage and/or neutrophil depletion.
(A) Sudan Black staining in std, spi1b, and csf3r morphants. Scale bar, 300 μm. Knockdowns by the spi1b and csf3r MOs decreased the number of neutrophils. (B) Quantification of Sudan Black staining (A; posterior to the yolk extension). Data are presented as means ± SEM. Student’s t test, ***p<0.001. (C) Analysis of apoeb expression in std and irf8 morphants. The irf8 MO inhibited differentiation of glial cells marked by apoeb. Scale bar, 100 μm. (D) ISH analysis of mpx expression, a neutrophil marker, at 2 hpa in amputated fin fold of larvae injected with std, spi1b, or csf3r MOs. mpx-positive cells were not detected in the spi1b or csf3r morphants. Arrowheads indicate representative neutrophils. Scale bar, 25 μm. (E) ISH analysis of lcp1, a macrophage marker, at 6 hpa in amputated fin fold of larvae injected with std, spi1b, or irf8 MOs. Arrowheads indicate representative macrophages which have migrated to the injured site. lcp1-positive macrophages are rarely observed in amputated fin fold of the spi1b or irf8 morphants. Scale bar, 25 μm.