
|
Fig. 4
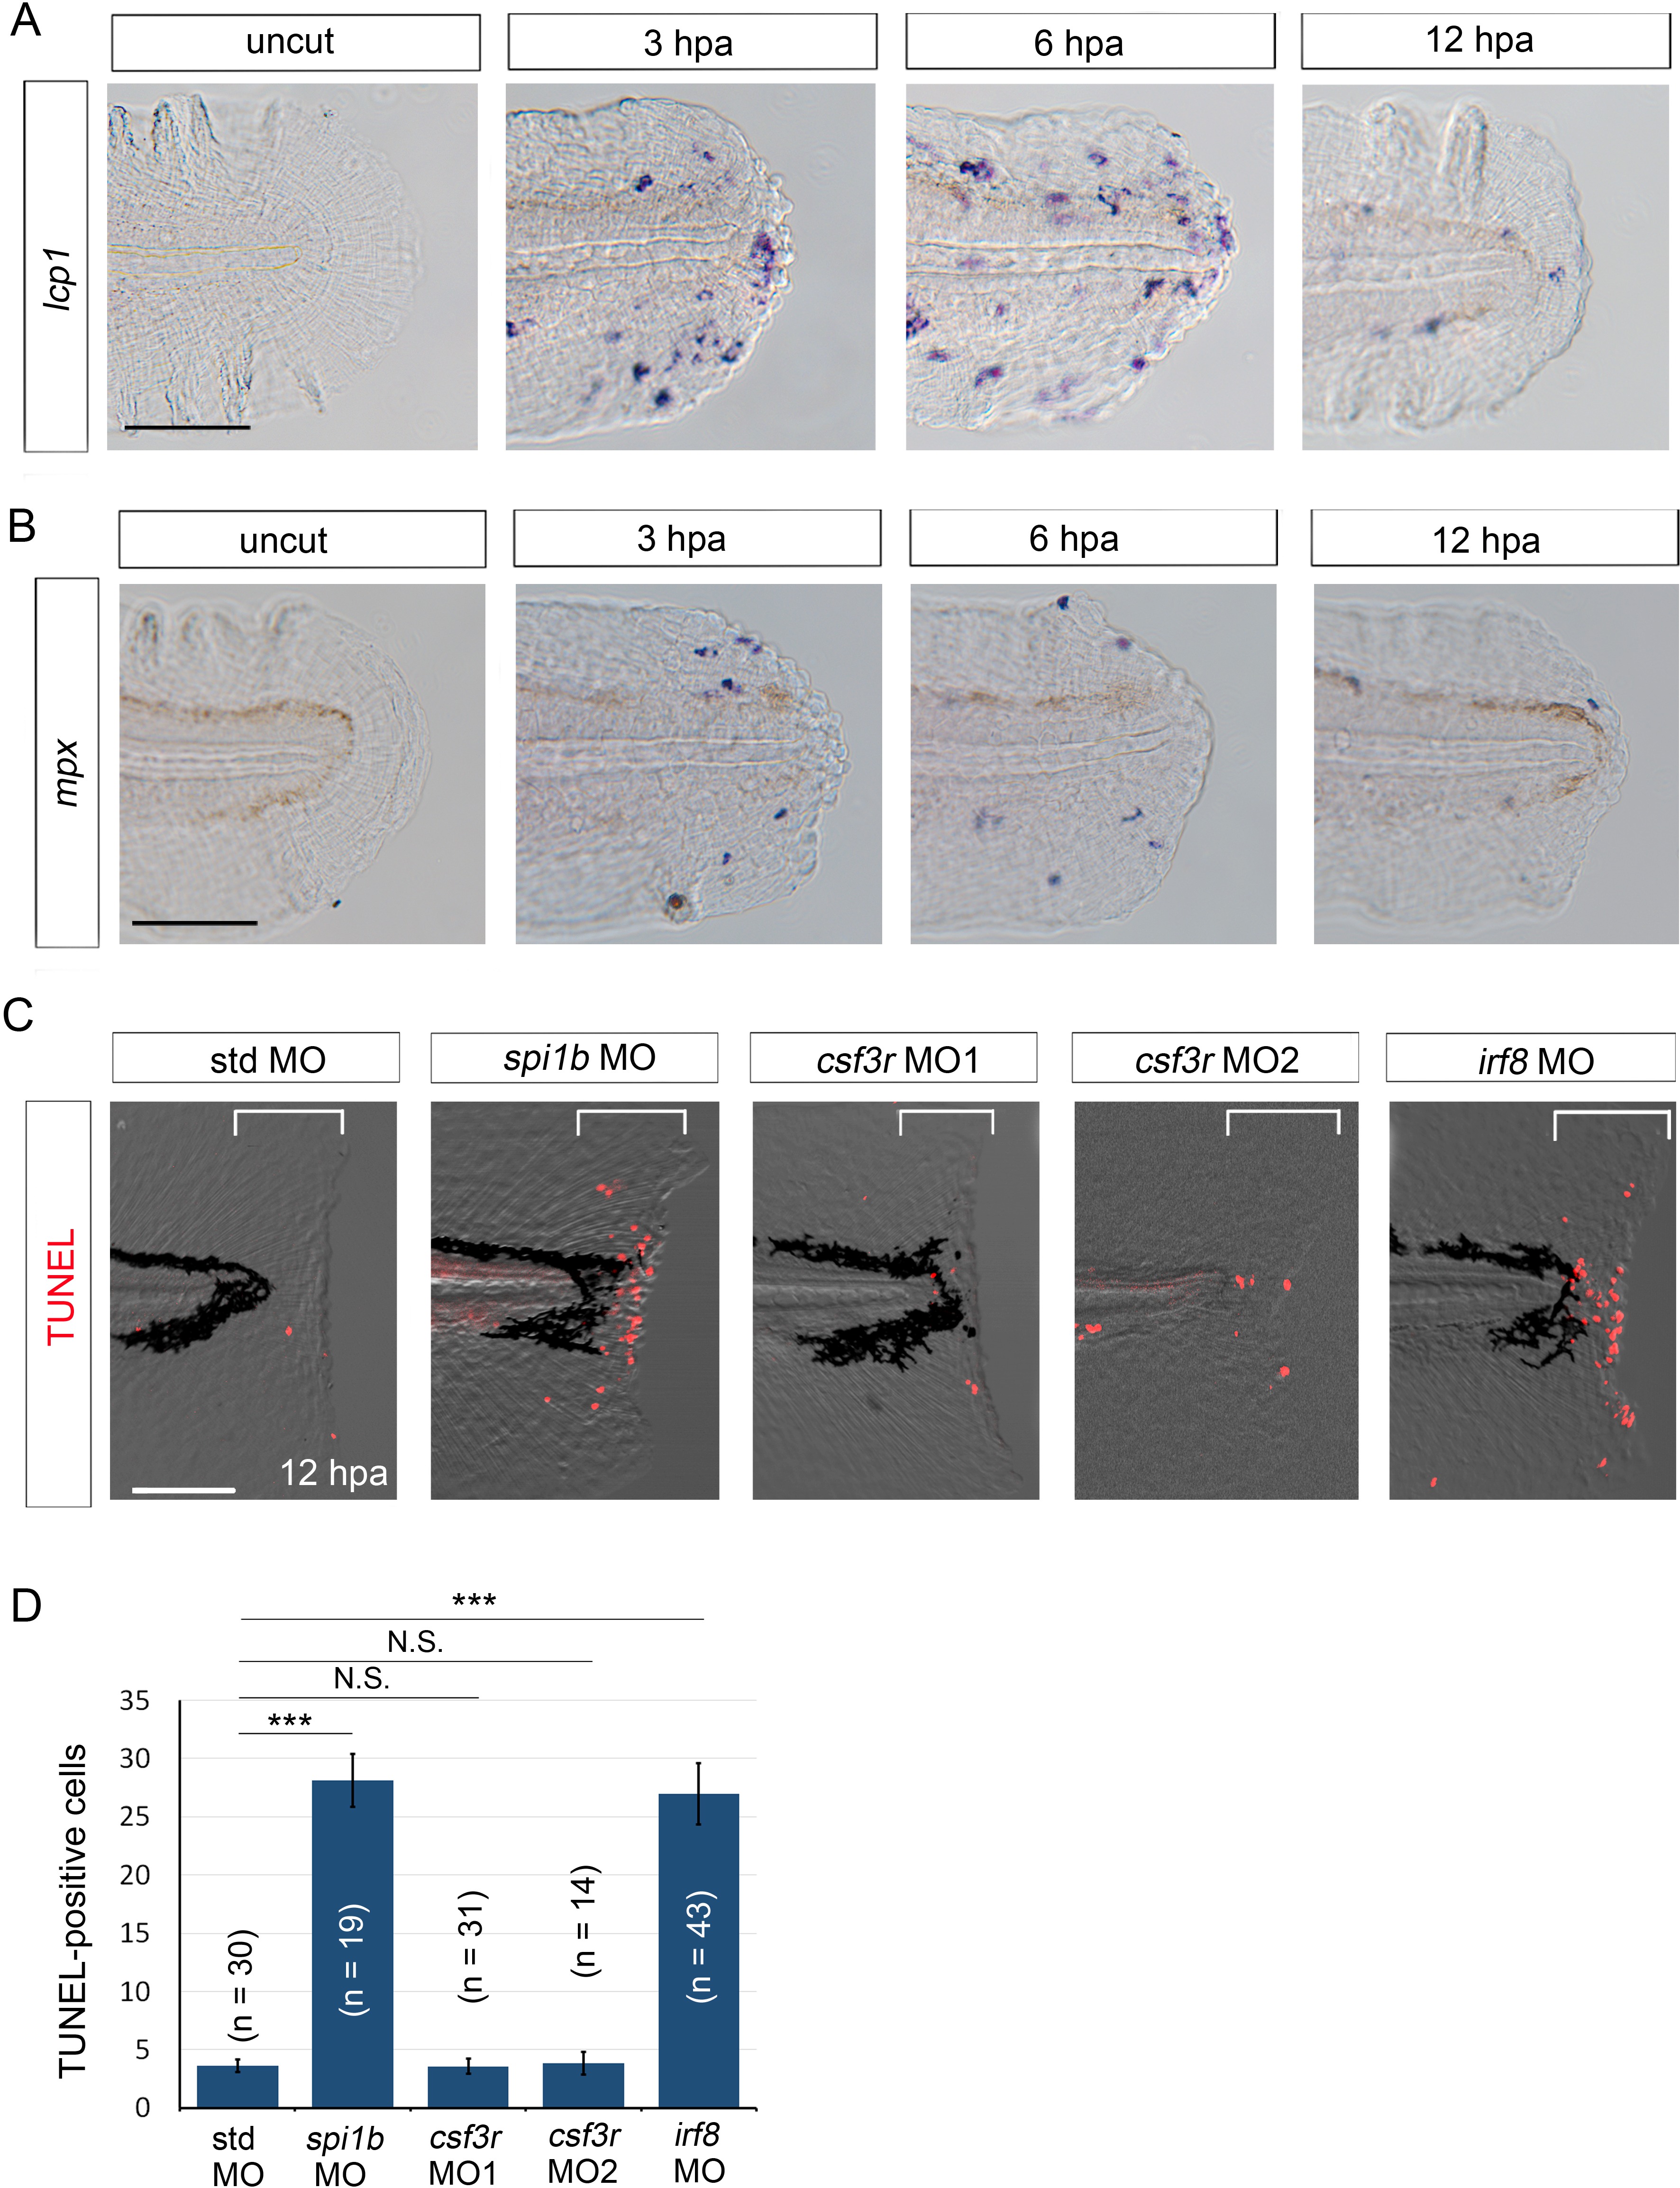
Macrophages are responsible for survival of regenerative cells.
(A) ISH analysis of lcp1 expression, a macrophage marker, during fin fold regeneration in WT. Scale bar, 50 μm. (B) ISH analysis of mpx expression, a neutrophil marker, during fin fold regeneration in WT. Scale bar, 50 μm. (C) TUNEL analysis in the amputated fin fold at 12 hpa after injection of spi1b, csf3r, and irf8 MOs. Injection of spi1b MO and irf8 MO markedly increased apoptosis of regenerative cells. Scale bar, 100 μm. (D) Quantification of TUNEL-positive cells in the areas bracketed in (A). In (B), data are presented as means ± SEM. Student’s t test, ***p<0.001; N.S., not significant (p=0.981).