
|
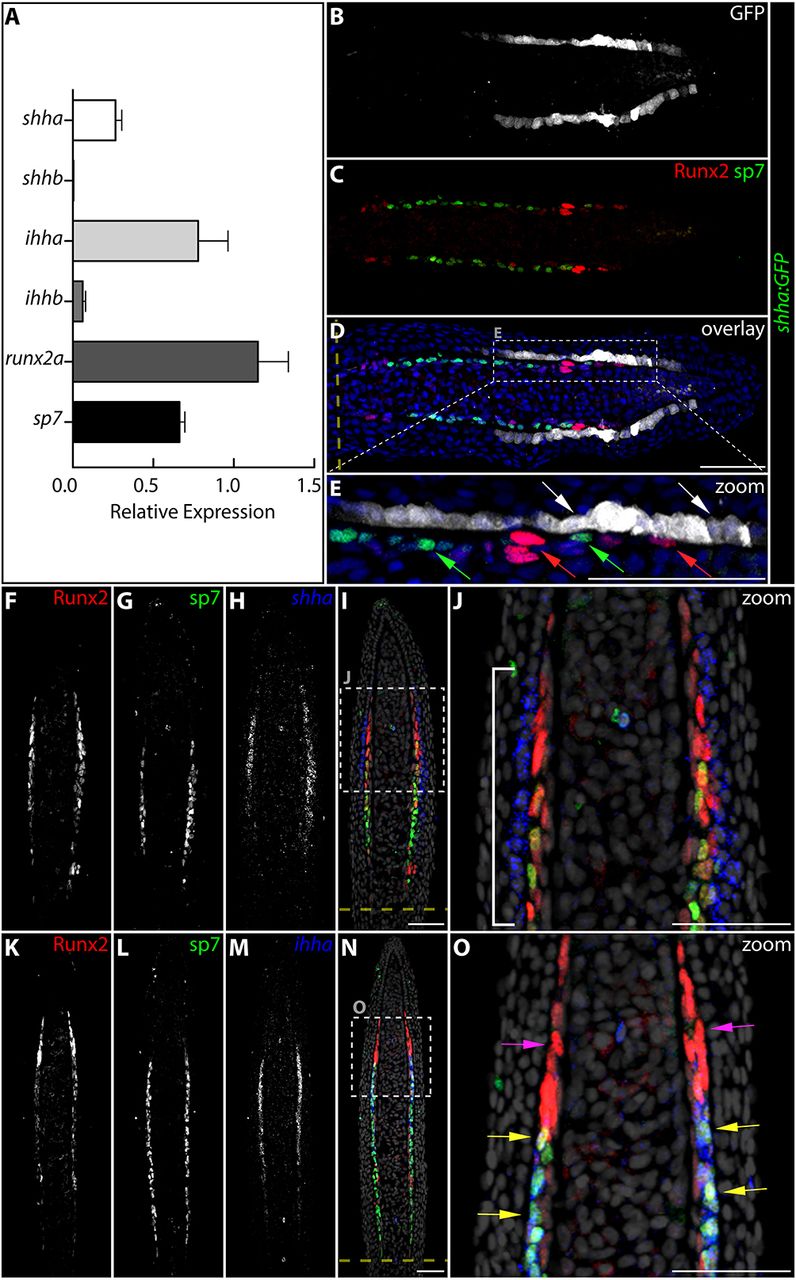
Fig. 2
shha is briefly transcribed by distal migrating epidermal cells, whereas ihha is restricted to re-differentiating progenitor osteoblasts. (A) qRT-PCR analysis of the relative expression levels of shha, shhb, ihha, ihhb, runx2a and sp7 in 96 hpa fin tissue. The relative levels of the indicated transcripts are means of four fins normalized to rpl8 expression. Error bars represent 1 s.d. (B-E) An immunostained fin section from a 72 hpa shha:GFP fish showing GFP (white), Runx2 (red) and sp7 (green) expression. Nuclei are in blue. E is a high-magnification view of the dashed box in D. (F-O) Fin sections from a 72 hpa fish stained by RNA in situ hybridization for shha (F-J) or ihha (K-O) transcripts (blue) and with Runx2 (red) and sp7 (green) antibodies. Single channels are shown in gray scale (F-I,K-N). Nuclei are gray in the overlay images (I,J,N,O). (J,O) Enlarged regions marked in I,N, respectively. The white bracket indicates the extent of epidermal cells expressing shha relative to pObs. Yellow arrows show Runx2+/sp7+ Obs that express ihha; magenta arrows mark distal Runx2+ pObs that lack ihha mRNA. The dashed yellow lines indicate amputation sites. Scale bars: 25 μm in J,O; 50 µm in E; 50 μm in B-D,F-N.