
|
Fig. 2 S1
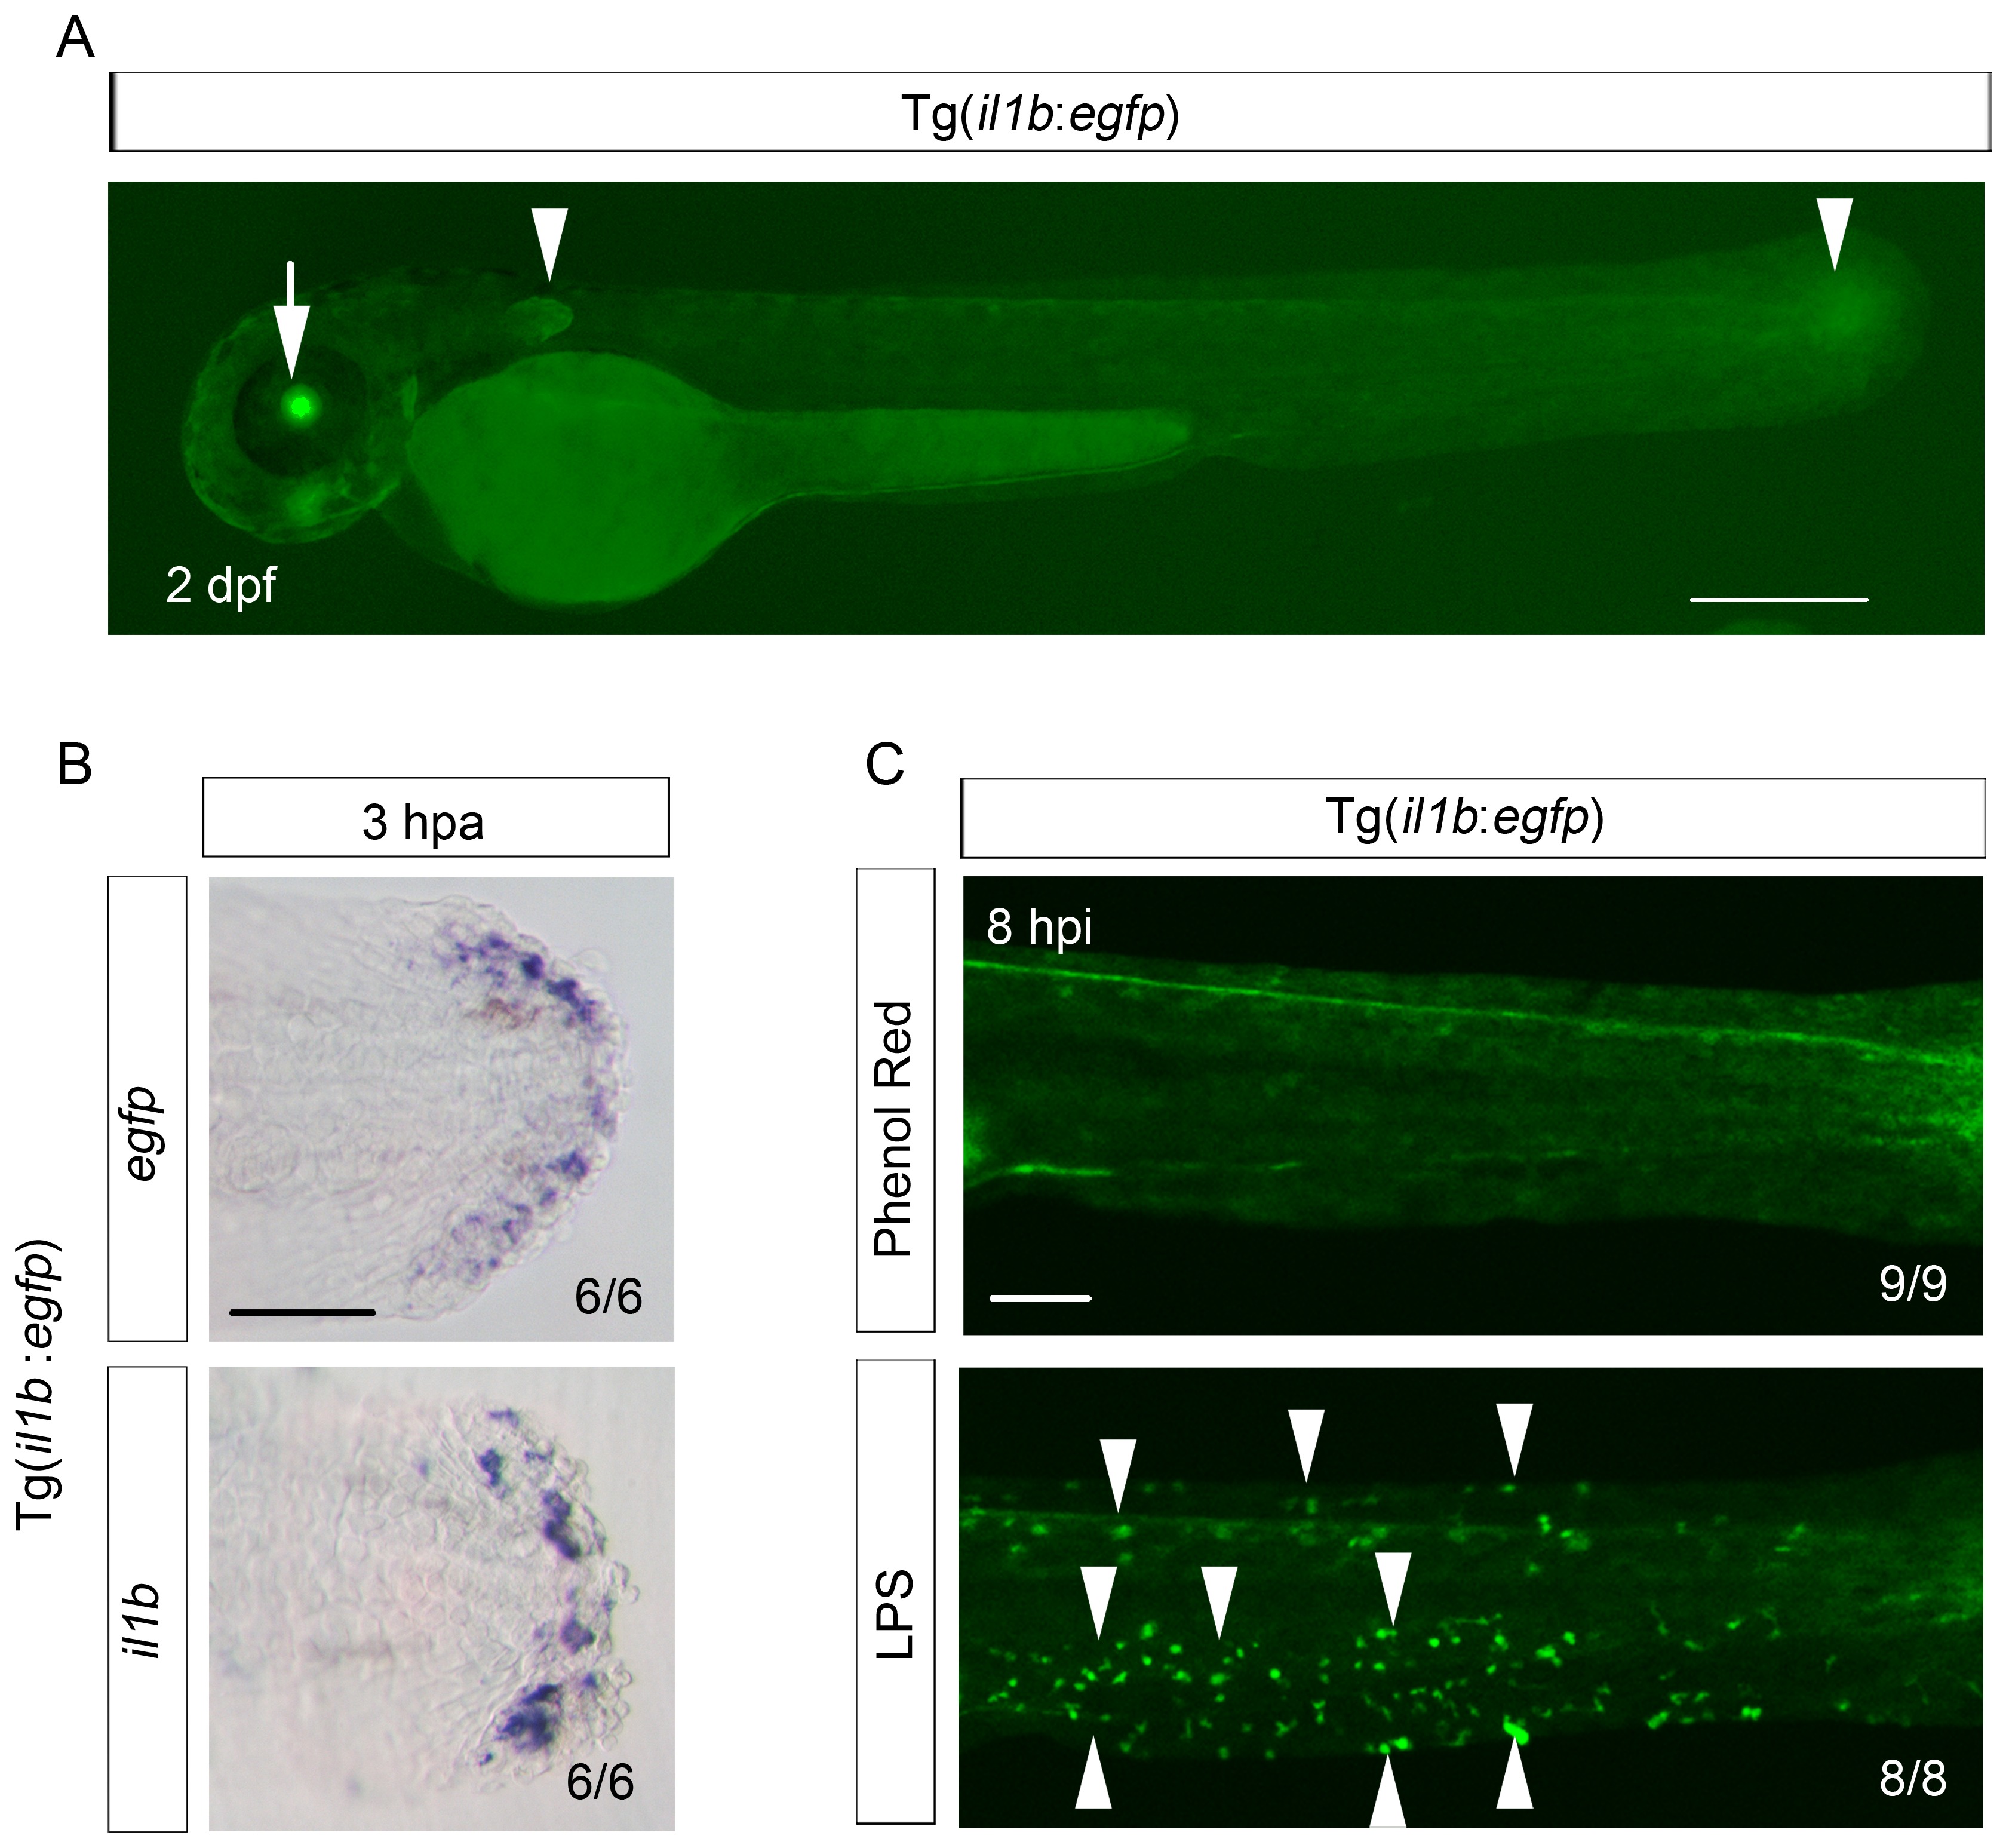
Reproduction of il1b expression in the Tg(il1b:egfp) line.
(A) EGFP expression in Tg(il1b:egfp) at 2 dpa. Arrowheads, EGFP expression in the pectoral fins and the posterior tip of the notochord. Arrow, EGFP expression in the lens by crystalline alpha A:egfp inserted in the Tol2 vector. Scale bar, 300 μm. (B) ISH analysis of egfp and endogenous il1b expression in Tg(il1b:egfp). The two genes were expressed in the same pattern. Scale bar, 50 μm. (C) EGFP fluorescence in Tg(il1b:egfp) after injection of LPS or control solution containing phenol red. Arrowheads indicate some of the EGFP-positive myeloid cells in LPS-injected larvae at 2 dpf; hpi: hours post injection. Scale bar, 100 μm.