
|
Fig. 2
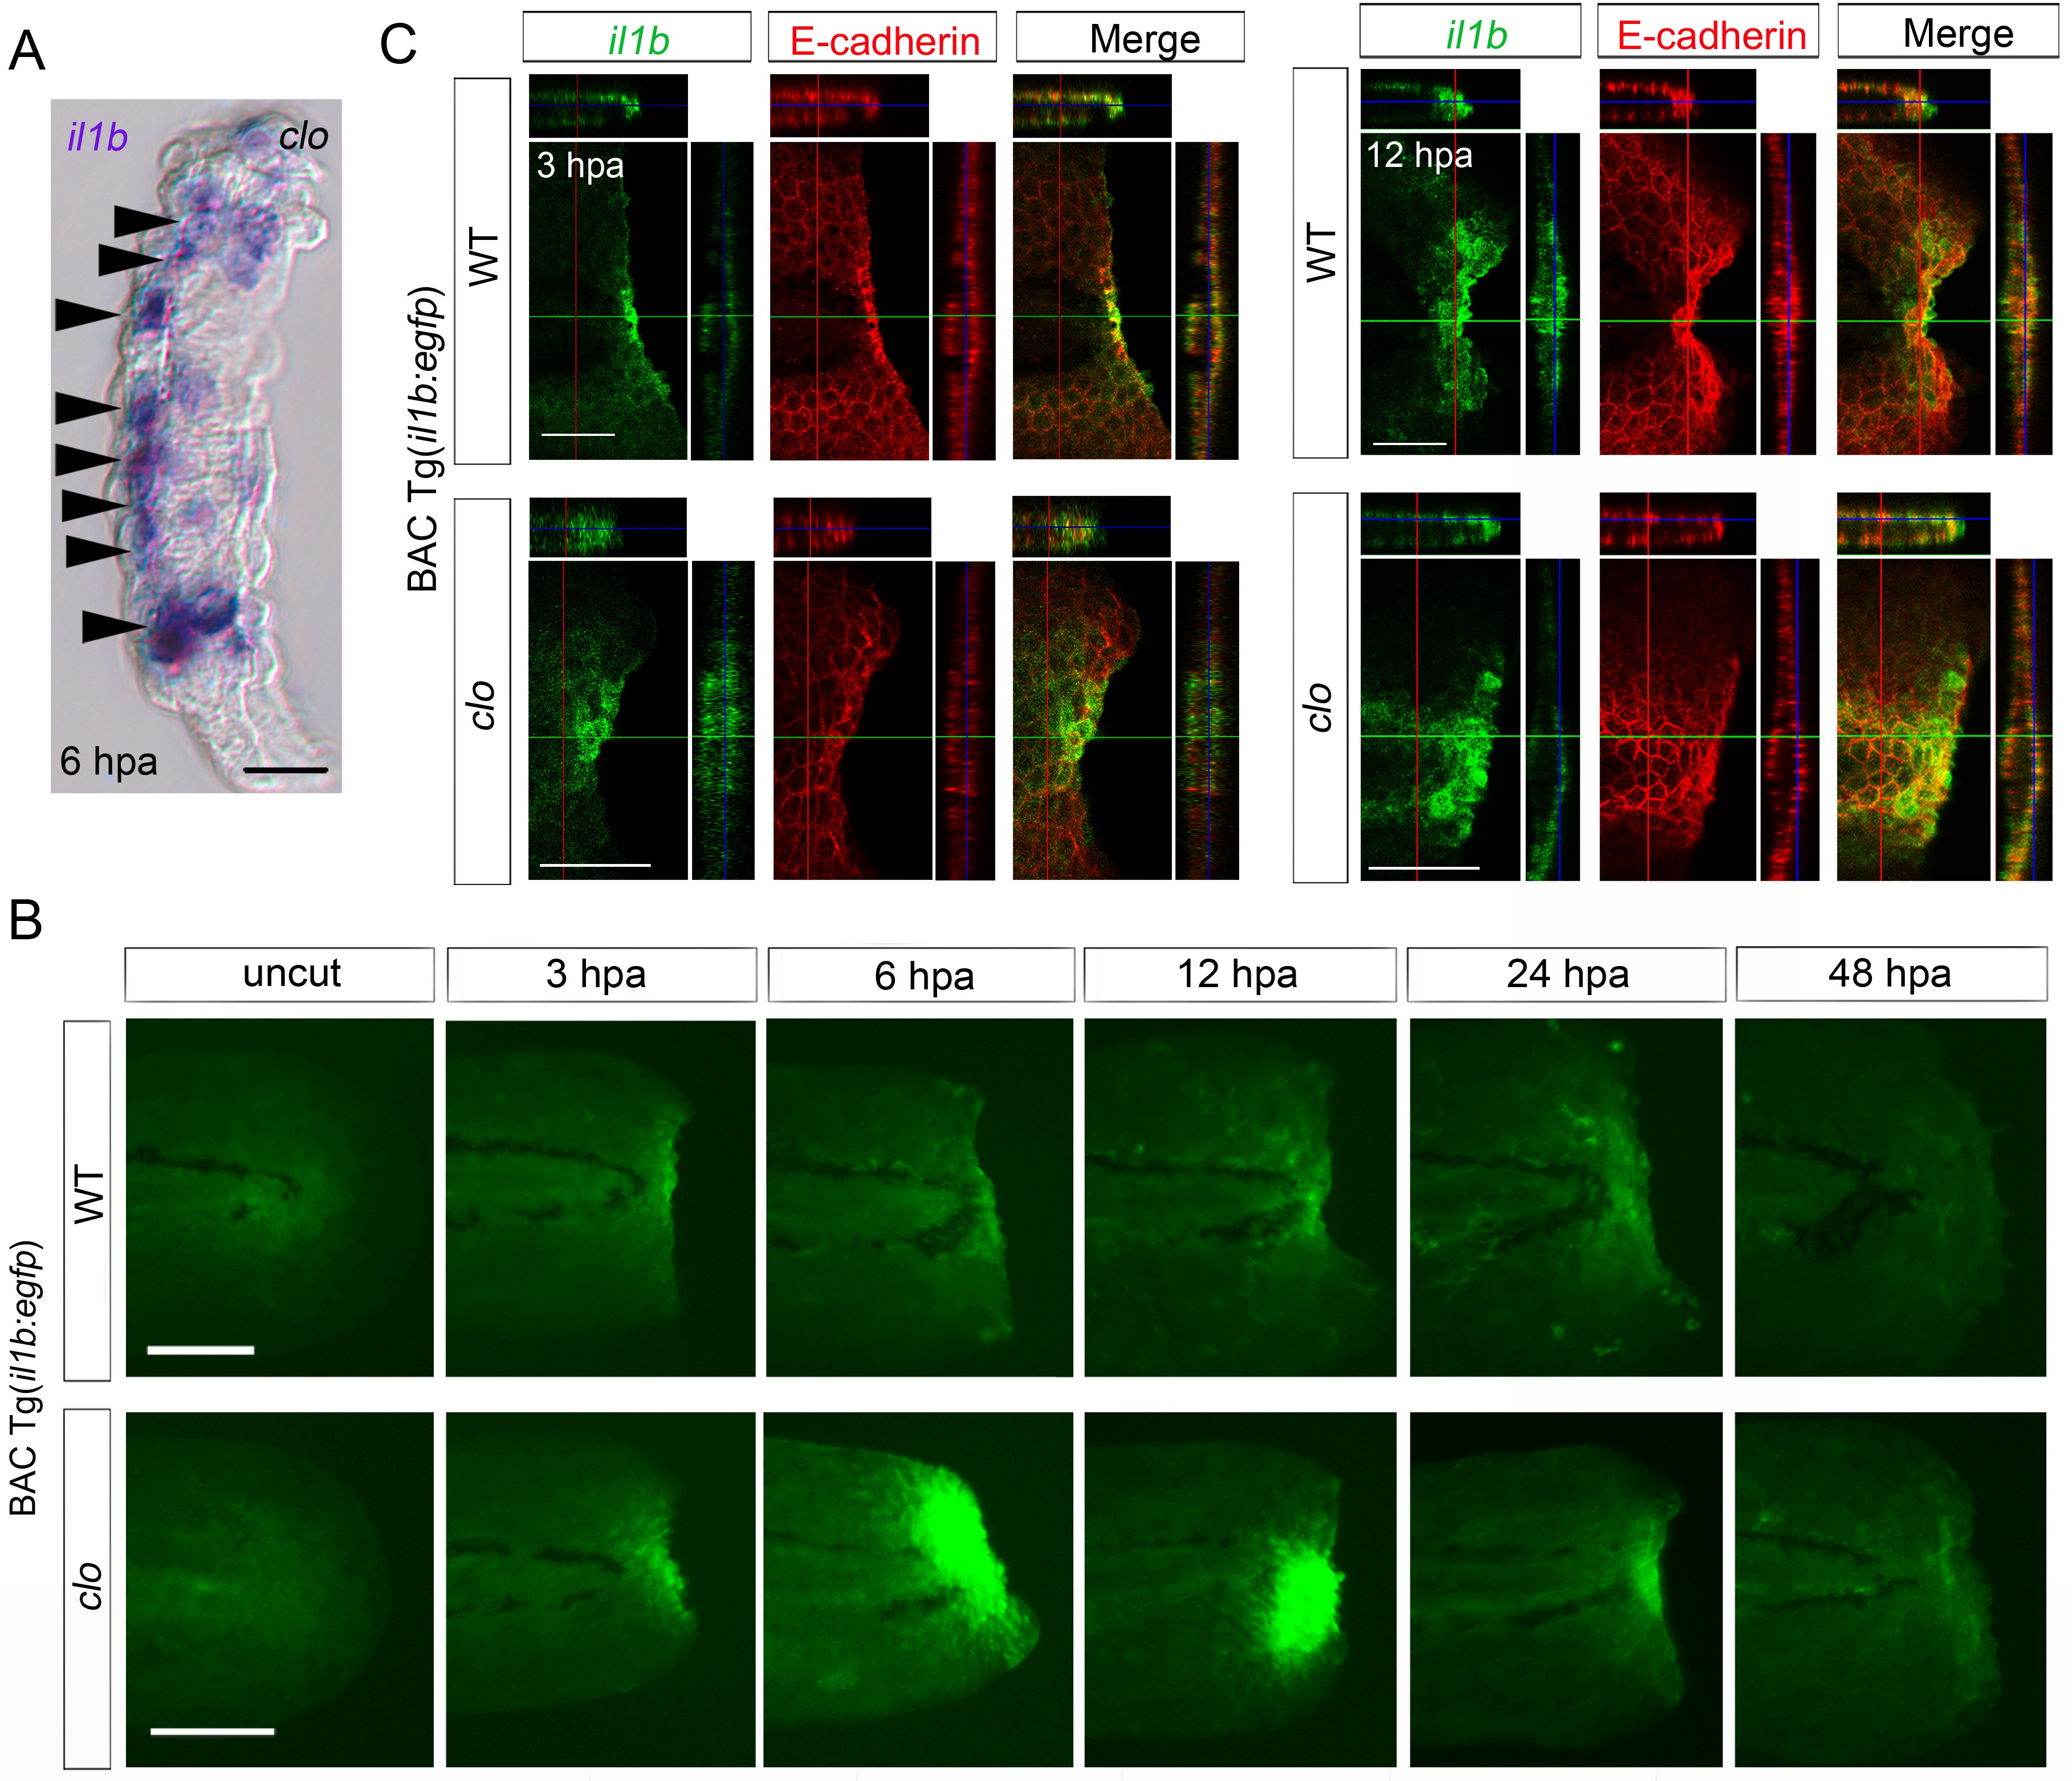
Spatiotemporal expression of il1b during fin fold regeneration.
(A) Tissue cryosection of an amputated clo fin fold in which il1b expression was detected using ISH analysis. Arrowheads indicate the epidermal cells expressing il1b. Scale bar, 10 μm. (B) Live imaging of il1b expression in the Tg(il1b:egfp) line in WT and clo mutant at corresponding stages of regeneration. As in the case of il1b expression observed in ISH analysis (Figure 1C), EGFP fluorescence of the Tg(il1b:EGFP) was strongly upregulated in the clo mutant. The EGFP fluorescence in WT decreased more slowly than did the il1b mRNA signal, because of the comparatively longer half-life of the protein EGFP. Scale bars, 100 μm. (C) Immunofluorescence detection of EGFP and E-cadherin in Tg(il1b:EGFP) at 3 and 12 hpa. Confocal longitudinal and transverse optical sections are shown at the top and right side, respectively. Vertical and horizontal red and green lines indicate the approximate sites of the optical sections. Scale bars, 50 μm.