
|
Fig. 6 S1
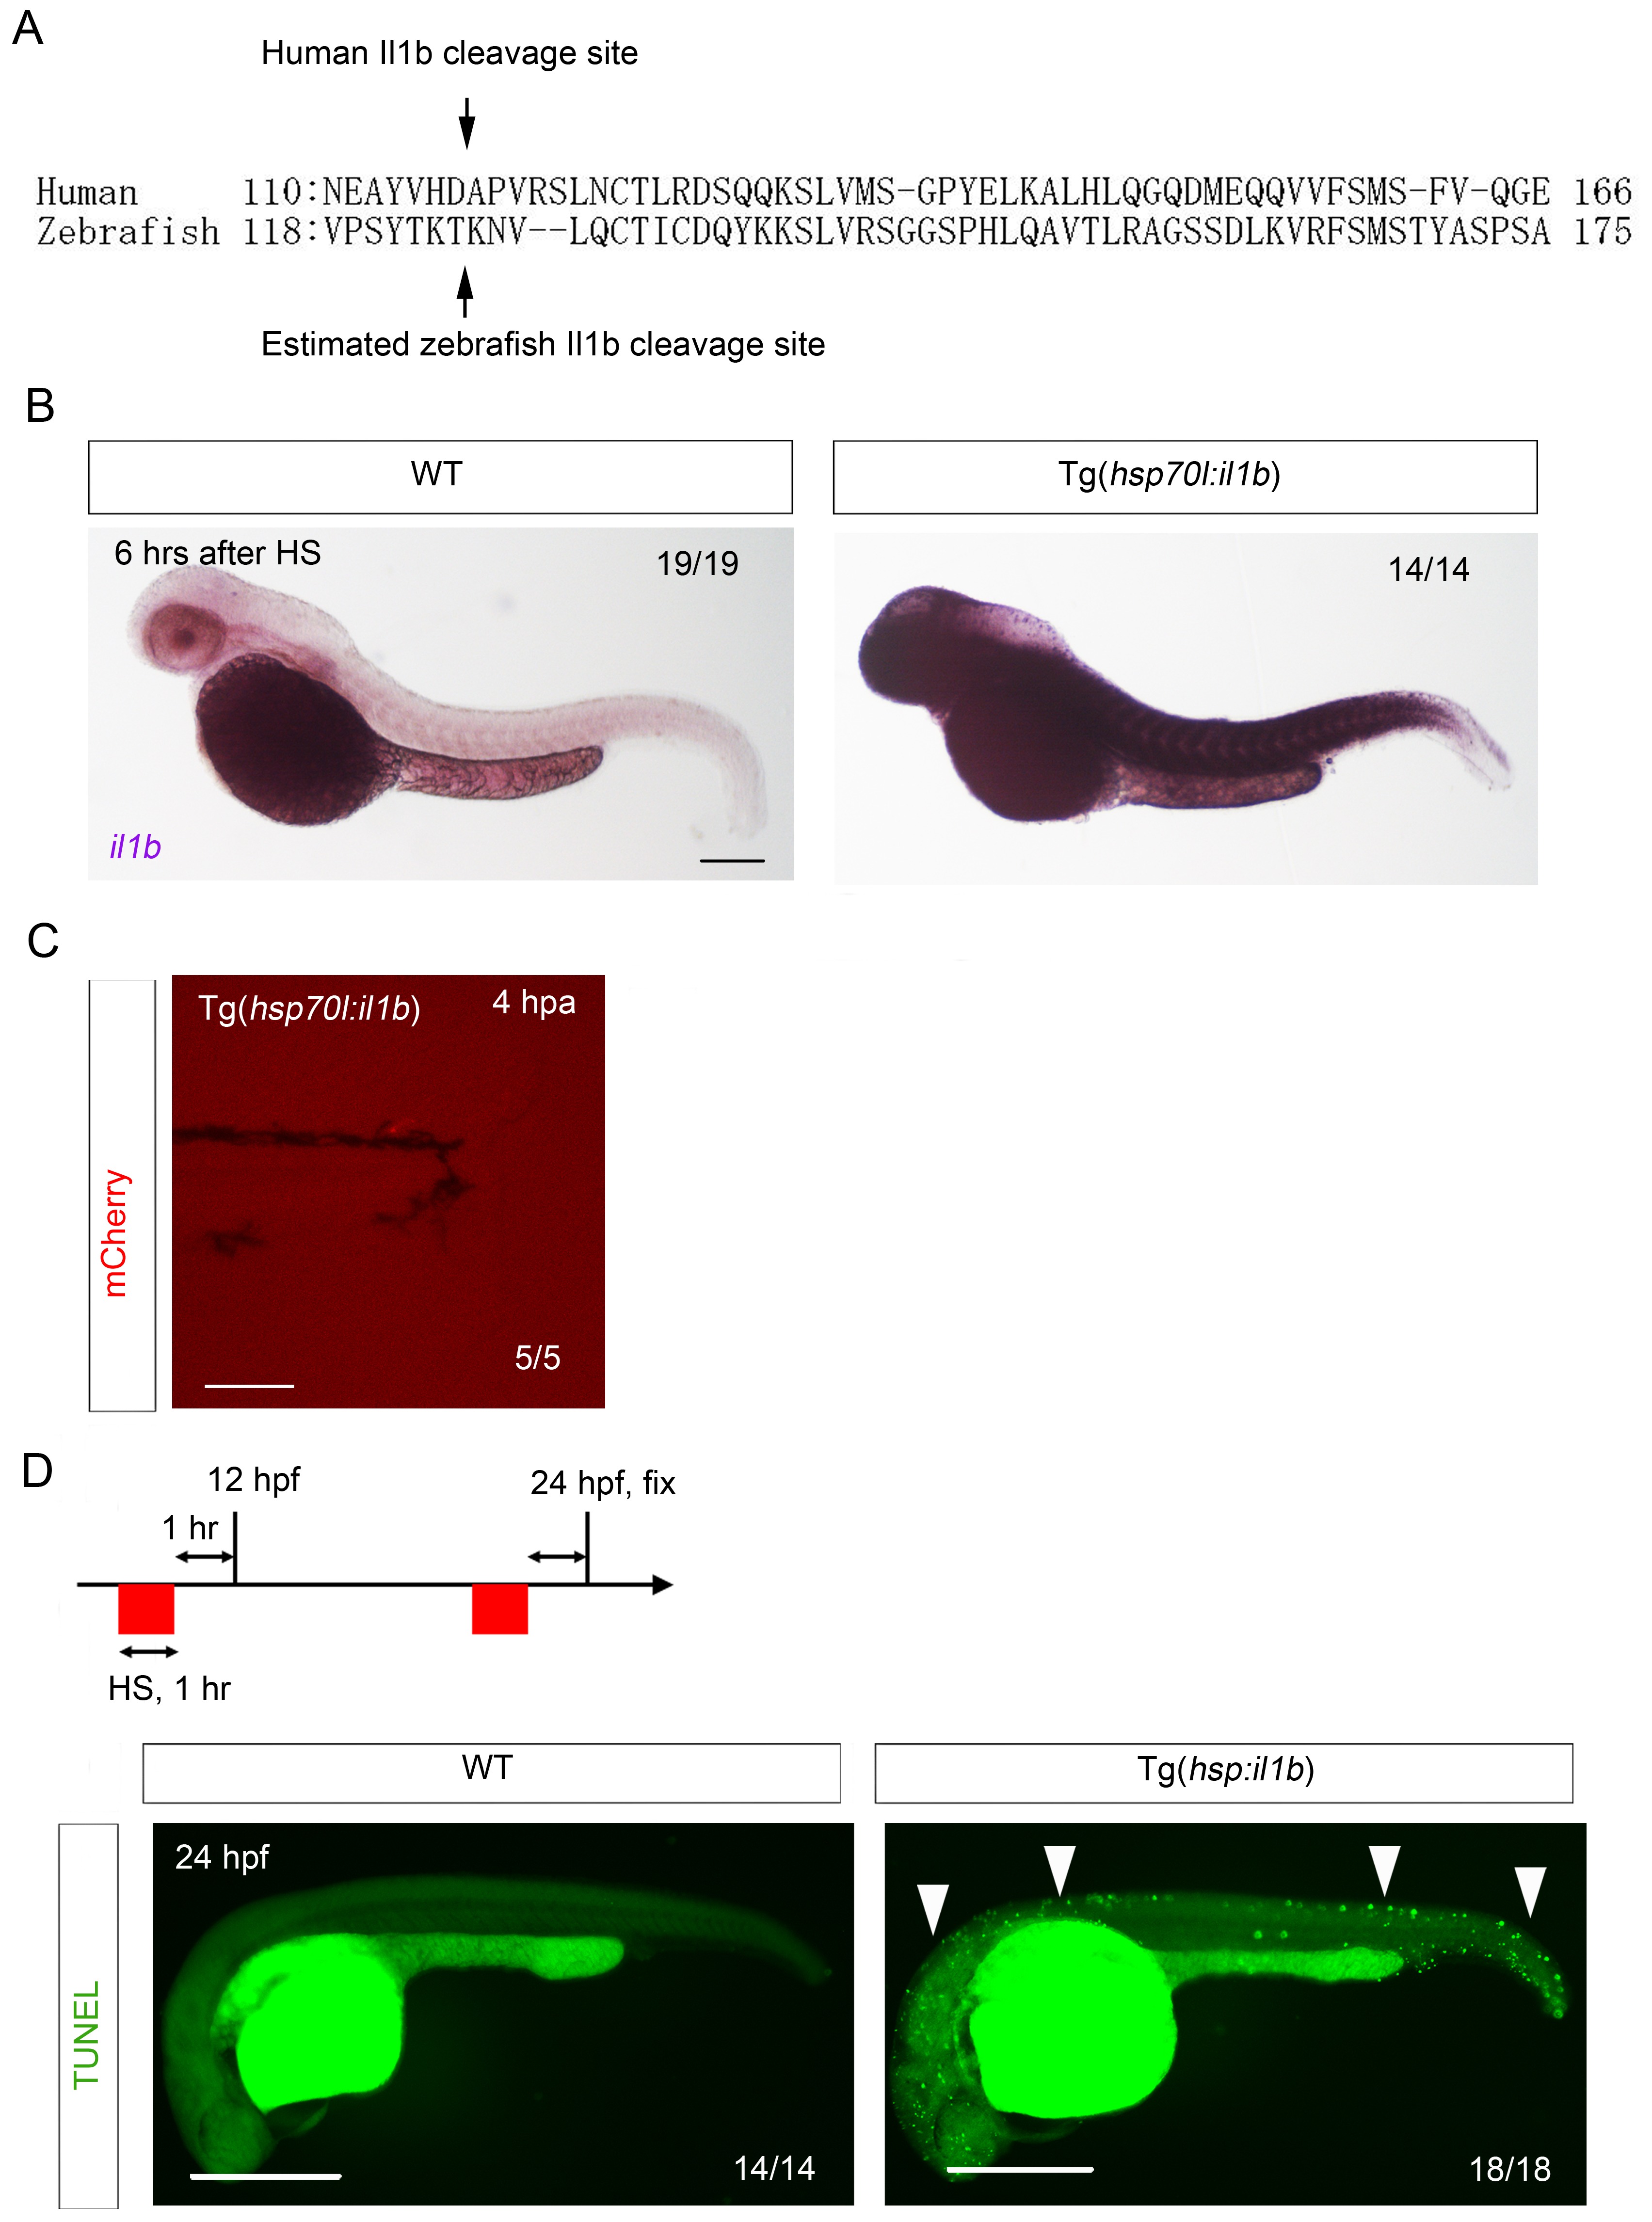
Generation of Tg(hsp:il1b).
(A) Comparison of zebrafish Il1b and human IL-1β amino acid sequences. Arrows indicate the human IL-1β cleavage site (D116) and the estimated zebrafish Il1b cleavage site (T124). (B) ISH analysis of il1b expression in Tg(hsp70l:il1b) at 6 hr after heat shock (HS). HS induced systemic il1b expression. Scale bar, 250 μm. (C) Absence of mCherry induction by fin fold amputation in the Tg(hsp70l:il1b). A stress caused by fin fold amputation did not induce mCherry expression. Scale bar, 100 μm. (D) TUNEL analysis of Tg(hsp70l:il1b) at 24 hpf after induction of il1b overexpression. The diagram depicts the experimental procedure. Scale bar, 500 μm.