
Fig. S1
- ID
- ZDB-IMAGE-170502-7
- Publication
- Zhang et al., 2017 - Critical Role for GAB2 in Neuroblastoma Pathogenesis through the Promotion of SHP2/MYCN Cooperation
- All Figures
- Figures for Zhang et al., 2017
|
Fig. S1
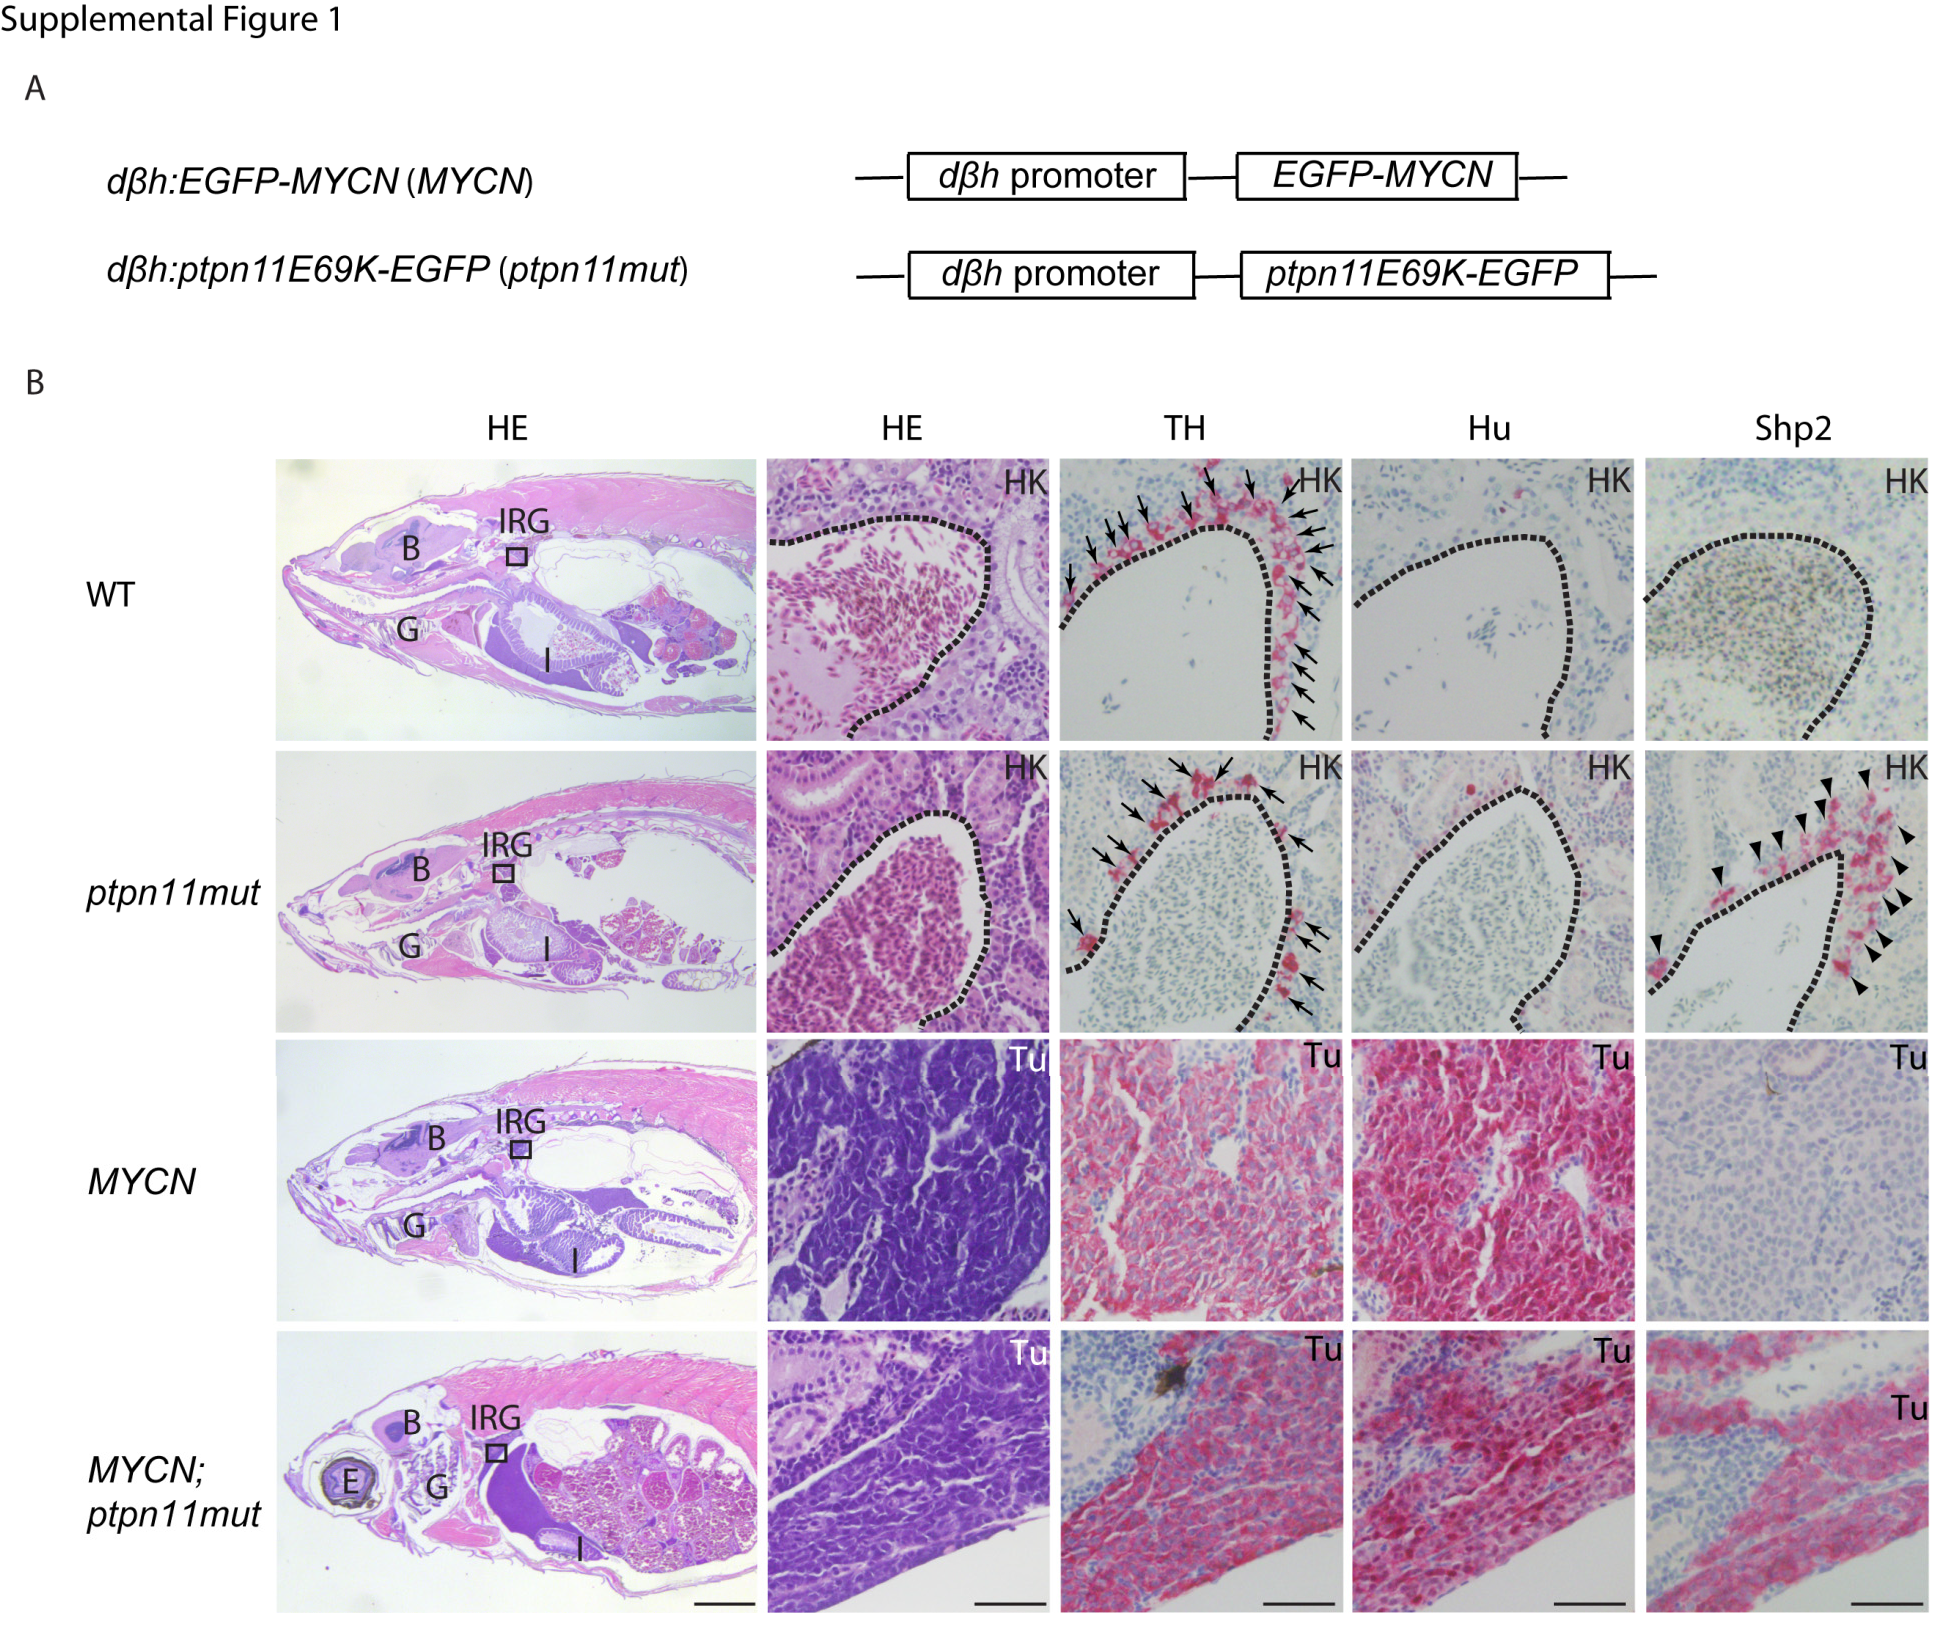
Histopathologic and immunohistochemical analyses of wild-type (WT), ptpn11mut, MYCN-only and MYCN;ptpn11mut fish. Related to Figure 1
(A) Schematic of dβh:EGFP-MYCN (MYCN) and dβh:ptpn11mut-EGFP (ptpn11mut) transgenic constructs. I-SceI sites are located on each end.
(B) Histopathologic and immunohistochemical analyses for the indicated antigens of the IRG regions of wild-type (WT), ptpn11mut, MYCN-only and MYCN;ptpn11mut fish. Left two columns: H&E-stained sagittal sections. Boxes indicate the interrenal gland (IRG), magnified in panels on the right. The remaining columns show immunohistochemical staining with tyrosine hydroxylase (TH, an enzyme in the catecholamine biosynthesis pathway) (Teitelman et al., 1979), Hu (a pan-neuronal marker), indicative of a PSNS-related neuronal origin (Marusich et al., 1994; Teitelman et al., 1979) and SHP2 antibodies, as indicated. Arrows indicate sympathoadrenal cells expressing TH in the IRG regions of WT or ptpn11mut fish (top two panels). Arrowheads indicate sympathoadrenal cells expressing Shp2-EGFP fusion protein in the IRG region of ptpn11mut transgenic fish (second panel from top, first column on right). Dotted lines indicate the head-kidney (HK) boundary. Scale bars, 1 mm (first column on left) and 50 μm (all other panels). B, brain; E, eyes; G, gill; I, intestine; IRG, interrenal gland; and Tu, tumors in the IRG of MYCN or MYCN;ptpn11mut fish.