
Image
|
Figure Caption
Fig. 4 S1
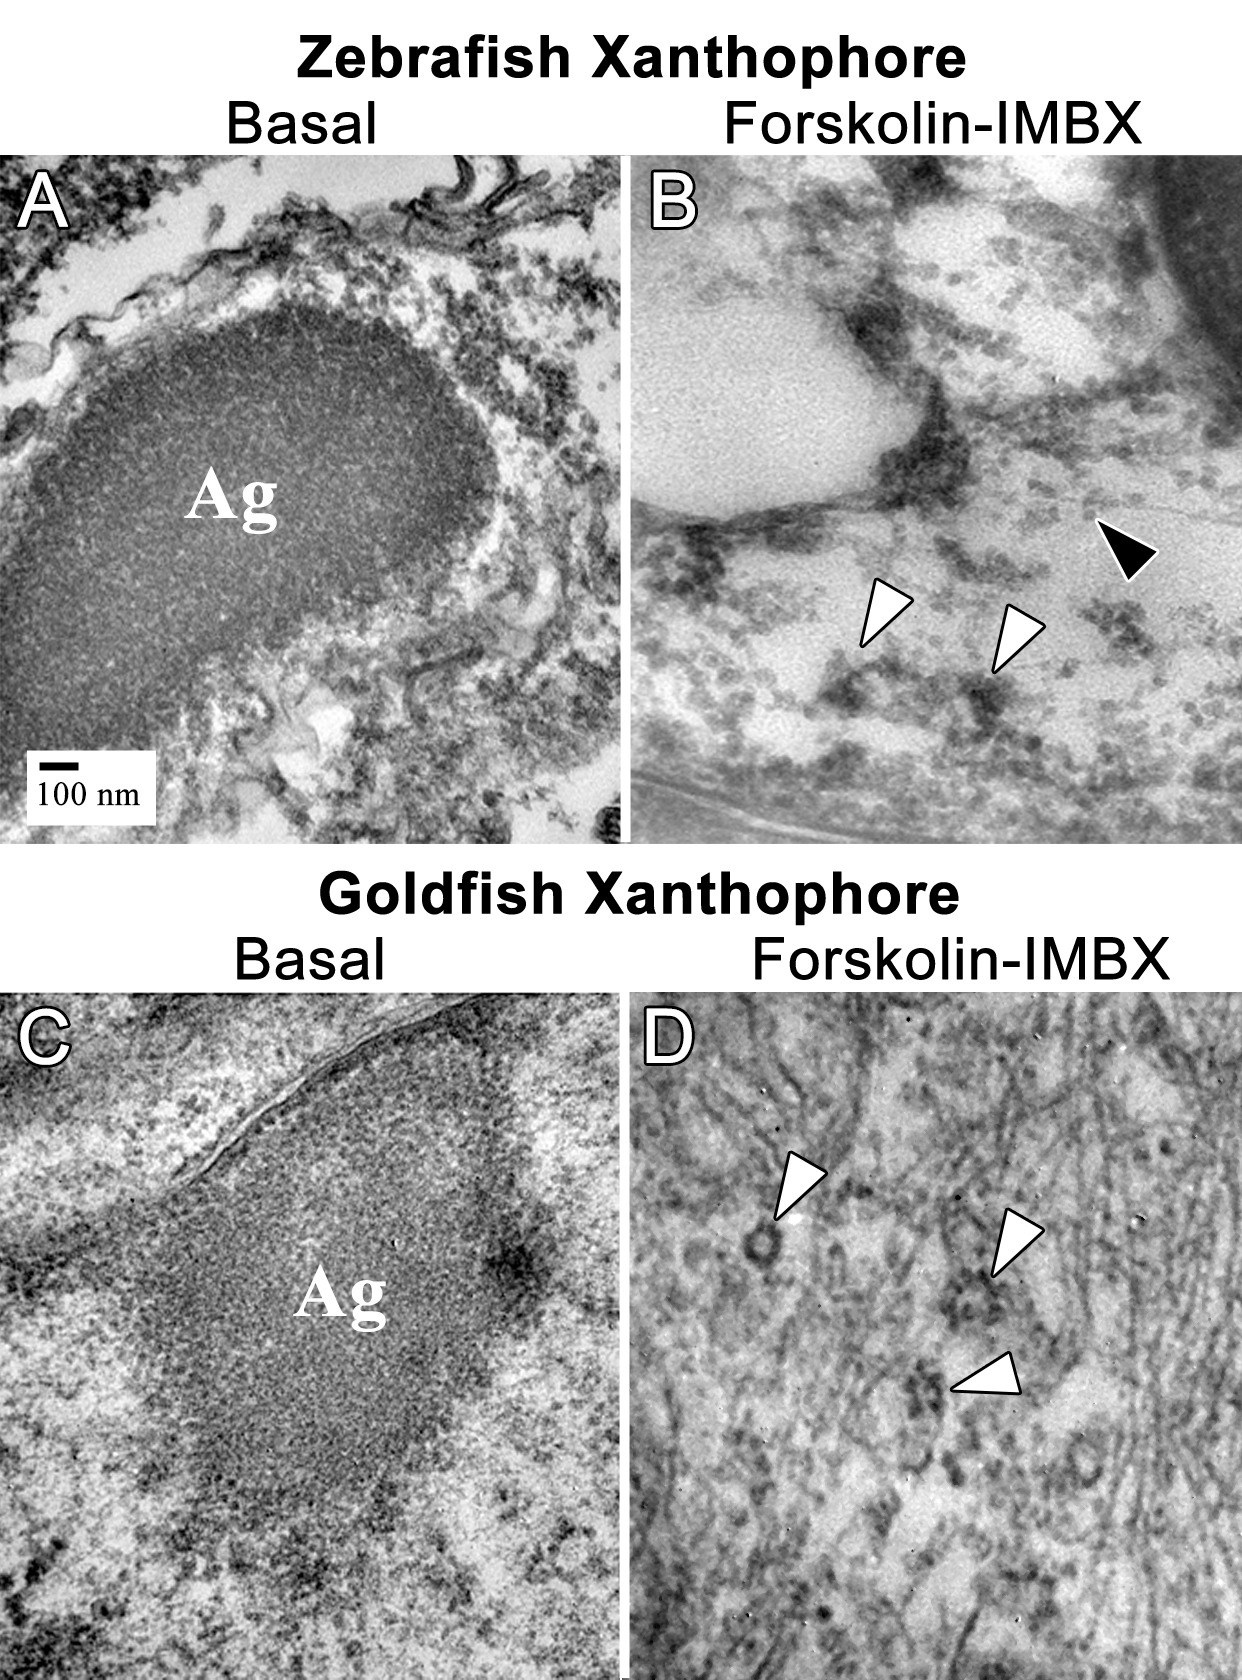
Thin section transmission electron microscopy (TSTEM) of zebrafish and goldfish xanthophores.
(A) A zebrafish xanthophore with aggregated CB (Ag). (B) TSTEM of a zebrafish xanthophore following forskolin-IBMX treatment shows clusters of dispersed CD (white arrowheads) and individual CD (black arrowhead). (C) TSTEM of a goldfish xanthophore with aggregated DB (Ag). (
Acknowledgments
This image is the copyrighted work of the attributed author or publisher, and
ZFIN has permission only to display this image to its users.
Additional permissions should be obtained from the applicable author or publisher of the image.
Full text @ Elife