
|
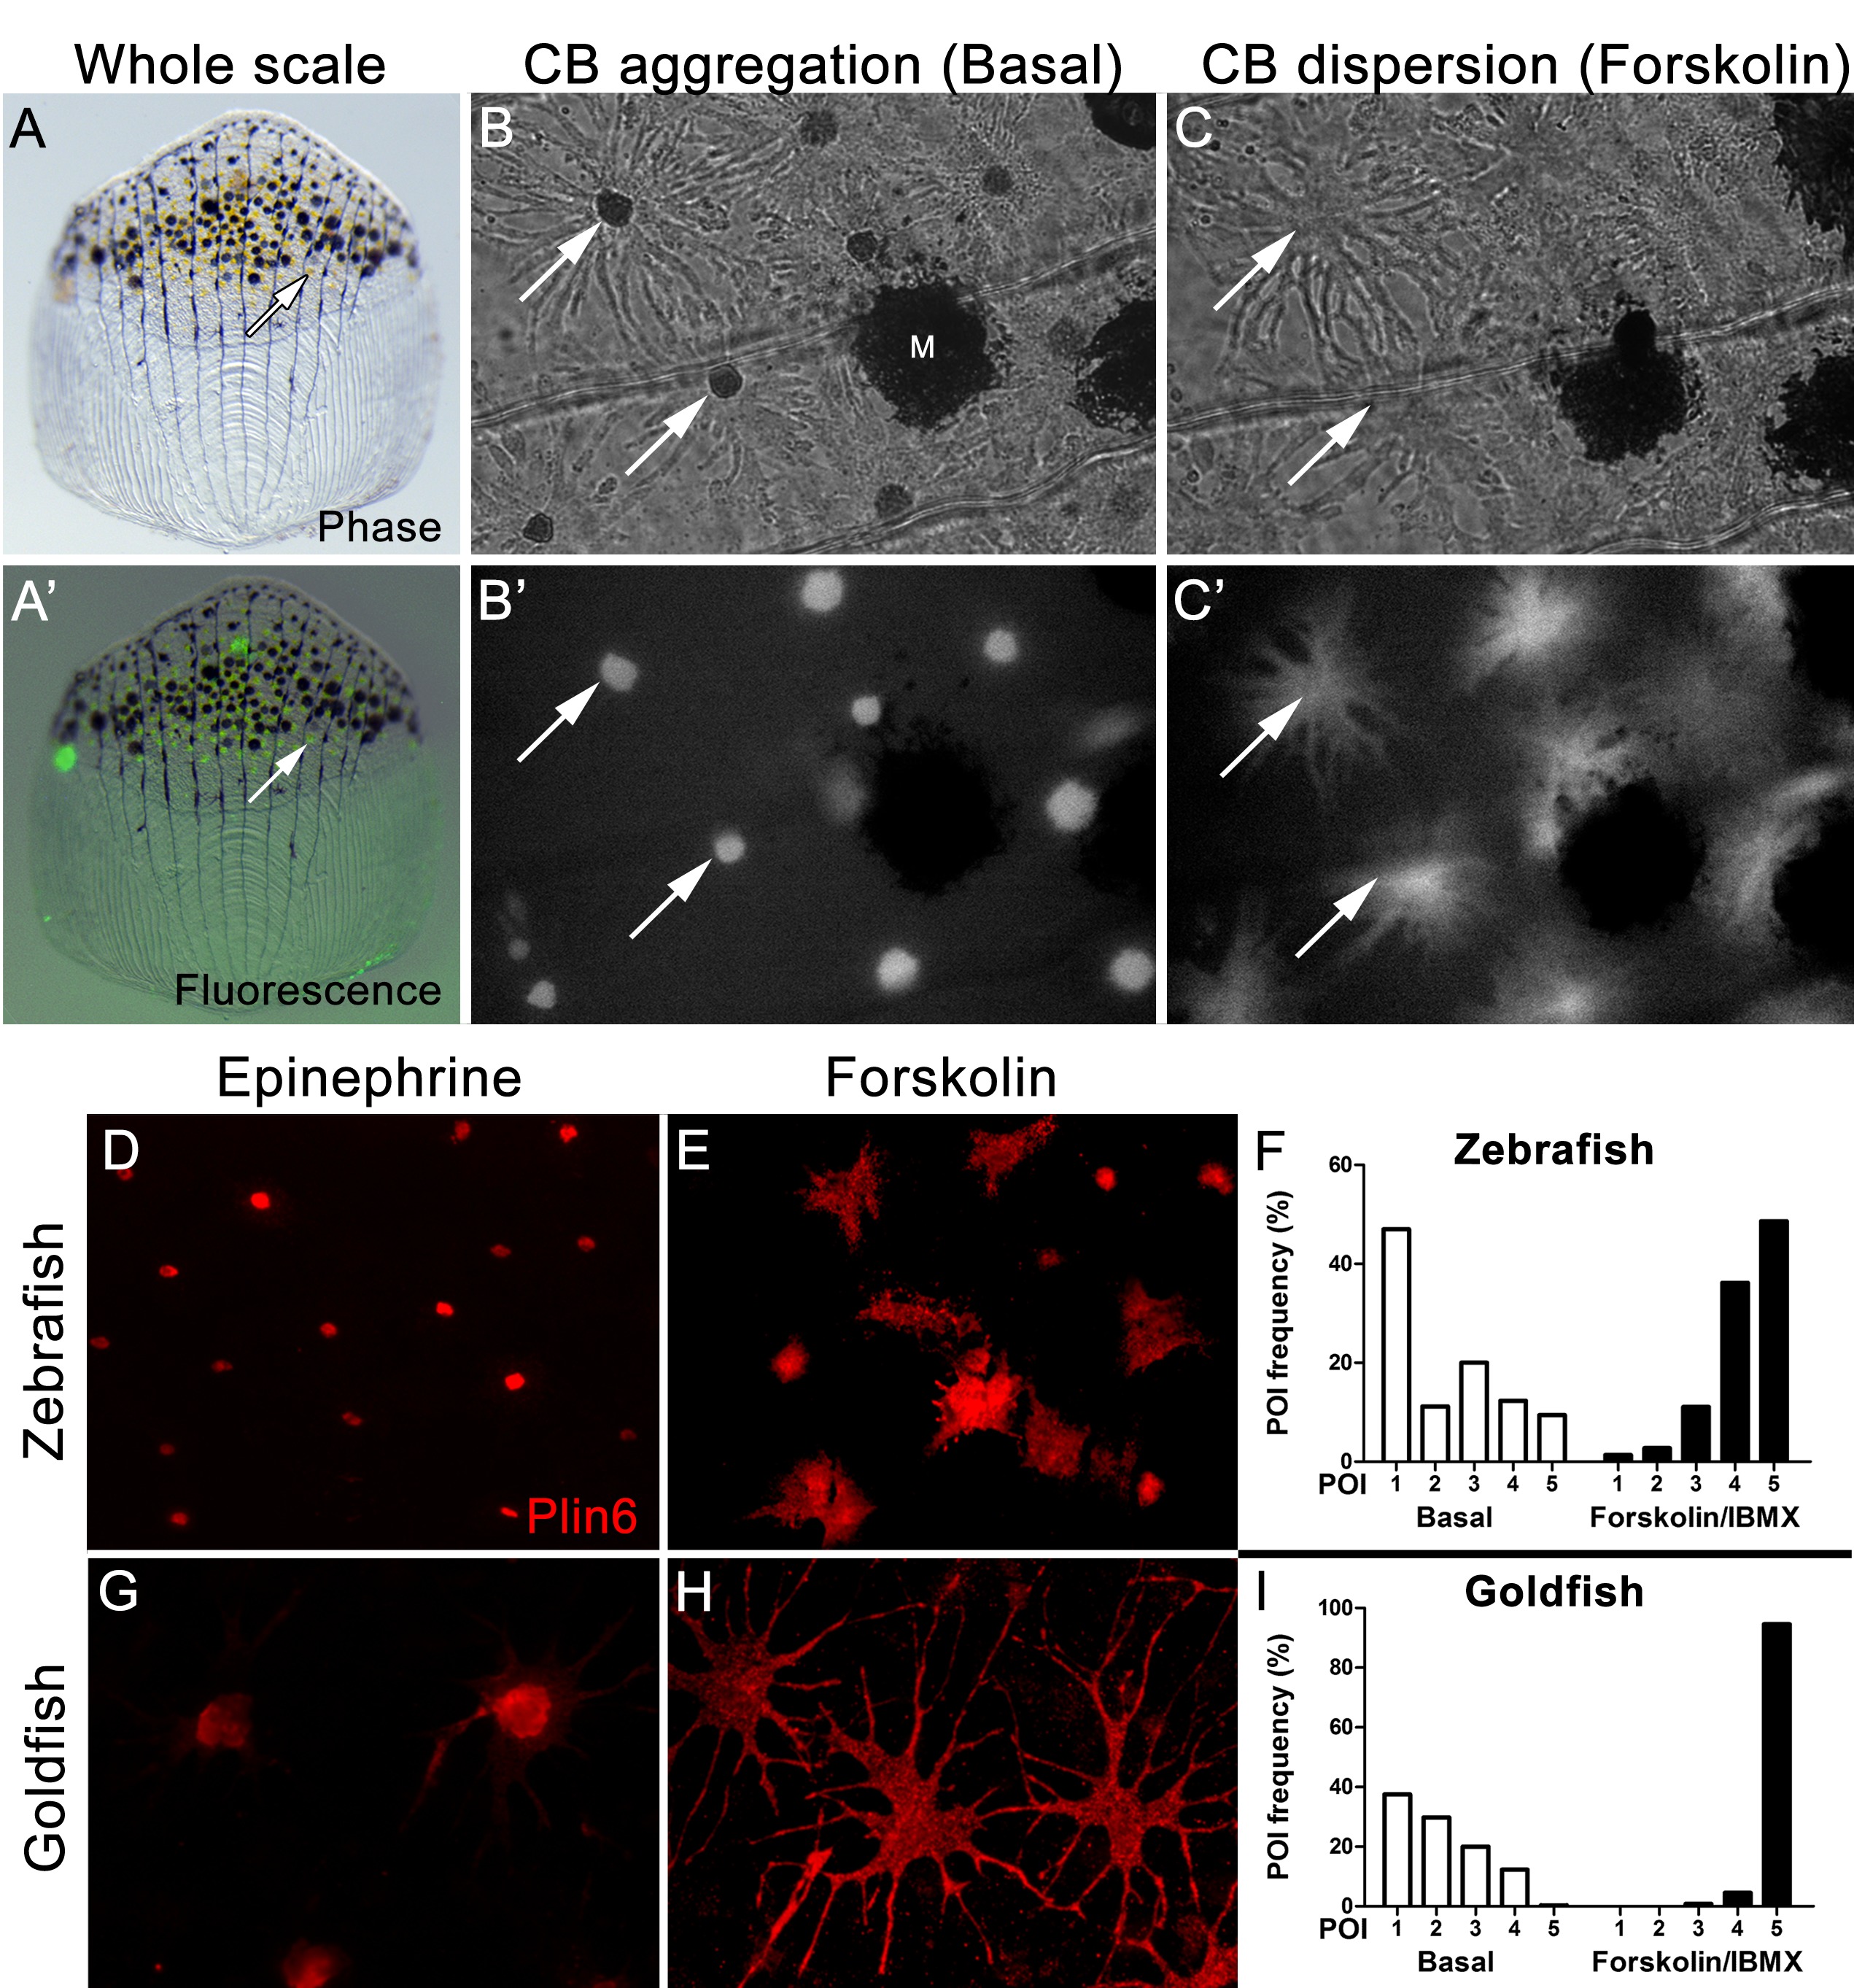
Fig. 4
Carotenoid pigment aggregation and dispersion in adult zebrafish xanthophores correlates to Plin6 expression.
(A) An isolated scale containing melanophores (black) and xanthophores (gold, arrow). (A’) Fluorescent and brightfield overlay showing xanthophore auto-fluorescence (the two large fluorescent spots are auto-fluorescent debris). (B) Higher magnification image showing many star-shaped xanthophores (arrows) in a basal state of pigment aggregation. A few melanophores (M) can also be visualized. (B’) The fluorescence image of B showing the auto-fluorescence in xanthophores. (C) Following a 1 hr incubation in forskolin, pigment is dispersed. (C’) The fluorescence image shows the pigment dispersion. (D–E) Plin6 is immunolocalized to xanthophores in isolated scales from zebrafish in both aggregated (D; Epinephrine) and dispersed states (E; Forskolin). (F) Quantification of the percentage of xanthophores at each Pigmentary Organelle Index (POI) normalized to 100% (p<0.0001). (G–H) Plin6 is immunolocalized to xanthophores in isolated scales from goldfish in both aggregated (G) and dispersed states (H). (I) Quantification of the percentage of xanthophores at each Pigmentary Organelle Index (POI) normalized to 100% (p<0.0001).