
|
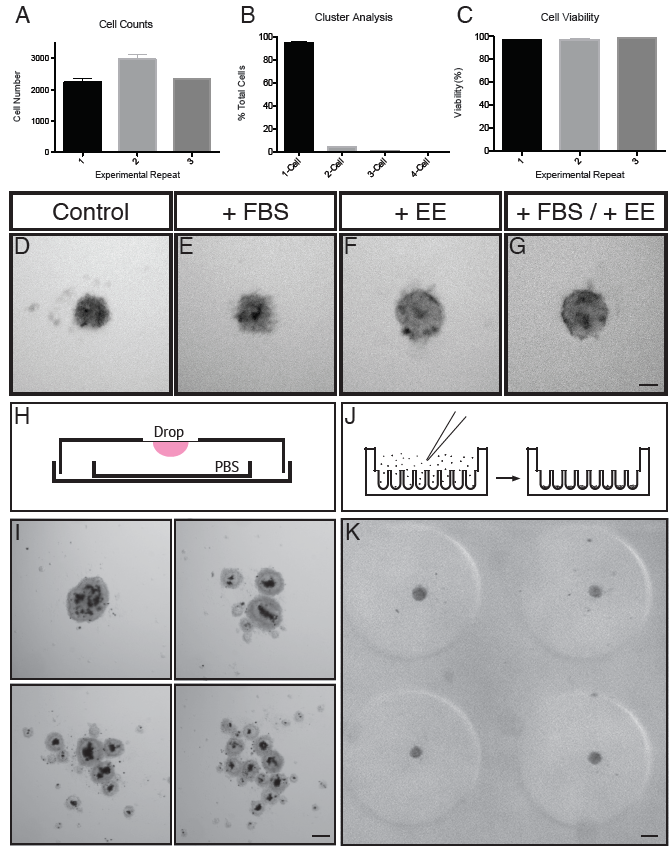
Fig. S1
Optimisation of Dissociation and Culture of Embryonic Zebrafish Retinal Cells in 3D Format.
(A) Cell counts for 3 experimental repeats (n = 3 for each). (B) Cluster analysis for the same experiments as in (A) (n = 9). (C) Percentage cell viability for the same 3 experimental repeats as in (A,B). (D-G) Comparison of cells cultured in the absence or presence of various supplements. (D) Cells cultured in control conditions (L-15 + PSF). (E) Cells cultured in control conditions and supplemented with FBS (+FBS). (F) Cells cultured in control conditions and supplemented with embryo extract (+EE). (G) Cells cultured in control conditions and supplemented with FBS and embryo extract (+FBS/ +EE). Scale bar = 50μm. (H) Schematic representing the hanging drop setup. Cells were seeded on the coverslip of a culture dish and inverted. A smaller dish containing PBS was placed inside to maintain a humid environment to prevent the drop drying out. (I) Representative examples of aggregates produced using the hanging drop method. Note the varying degrees of aggregation, some generating 1 whole aggregate, and others generating multiple smaller aggregates. Scale bar = 100μm. (J) Schematic representing the seeding chamber of the 3D Petri dish. After seeding, cells settle into individual wells. (K) A representative example of 4 wells of a culture in an agarose microwell dish cast from the 3D Petri Dish PDMS mould. Note the consistent size and shape of each aggregate. Scale bar = 100μm.