
Image
|
Figure Caption
Fig. S6
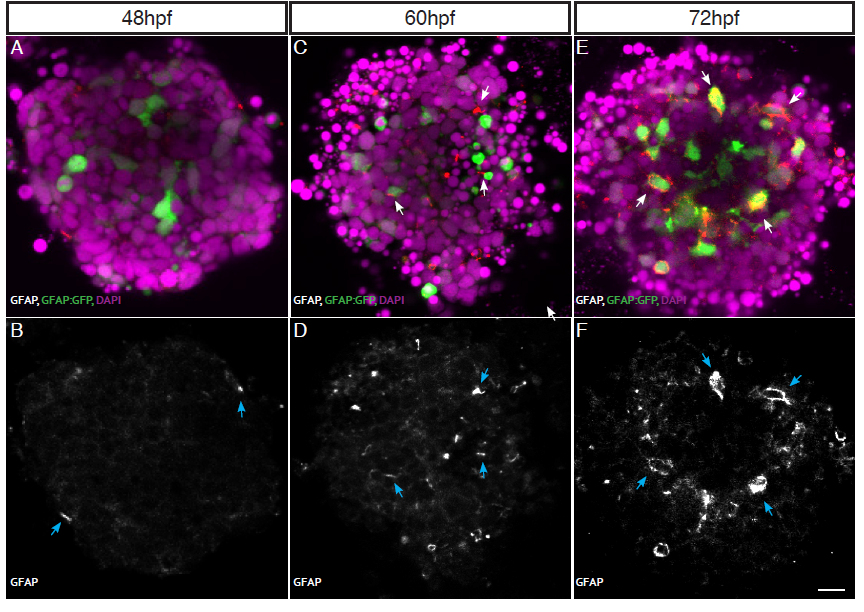
Müller Glia development is similar in aggregates as in vivo.
(A-B) GFAP expression starts to be seen in very few cells at 48hpf. (C-D) As Müller cells mature GFAP is expressed in more cells by 60hpf. (E-F) By 72hpf GFAP expression is seen in most, if not all, mature Müller cells. GFAP positive cells indicated with arrows. Scale bar = 10μm.
Acknowledgments
This image is the copyrighted work of the attributed author or publisher, and
ZFIN has permission only to display this image to its users.
Additional permissions should be obtained from the applicable author or publisher of the image.
Full text @ Development